

How to Make a Graphical Abstract for a Research Paper
Visual summary guide
Turn a paper’s central question, decisive approach, and supported finding into one concise visual story.
Scientific figure generator
Make a graphical abstract from your paper
Send this example, or paste your own abstract in the Graphical Abstract Maker linked at the end of this guide.
3 free figures for new accounts, no card. Downloads have no watermark.
Short answer
Start with the scientific message
Reduce the paper to three parts: the research question or context, the decisive method or mechanism, and the primary supported finding. Choose a layout that makes those parts readable in one direction, remove secondary experiments, and use short labels with a restrained visual system.
A graphical abstract should help a reader understand the take-home message quickly; it is not a collage of every result. Check the journal’s current dimensions and AI-image policy, then verify the visual claim against the abstract and main figures before submission.
- One honest research story is stronger than a miniature version of the whole paper.
- Layout should encode the relationship: flow, mechanism, comparison, or workflow.
- The abstract, main figures, and graphical abstract must make compatible claims.
Scope first
Choose the tool that matches the evidence
Explanatory illustration and measured evidence are different jobs. Keep that boundary visible throughout the workflow.
Use this generator for
- Question → method → finding summaries
- Mechanism-centered visual abstracts
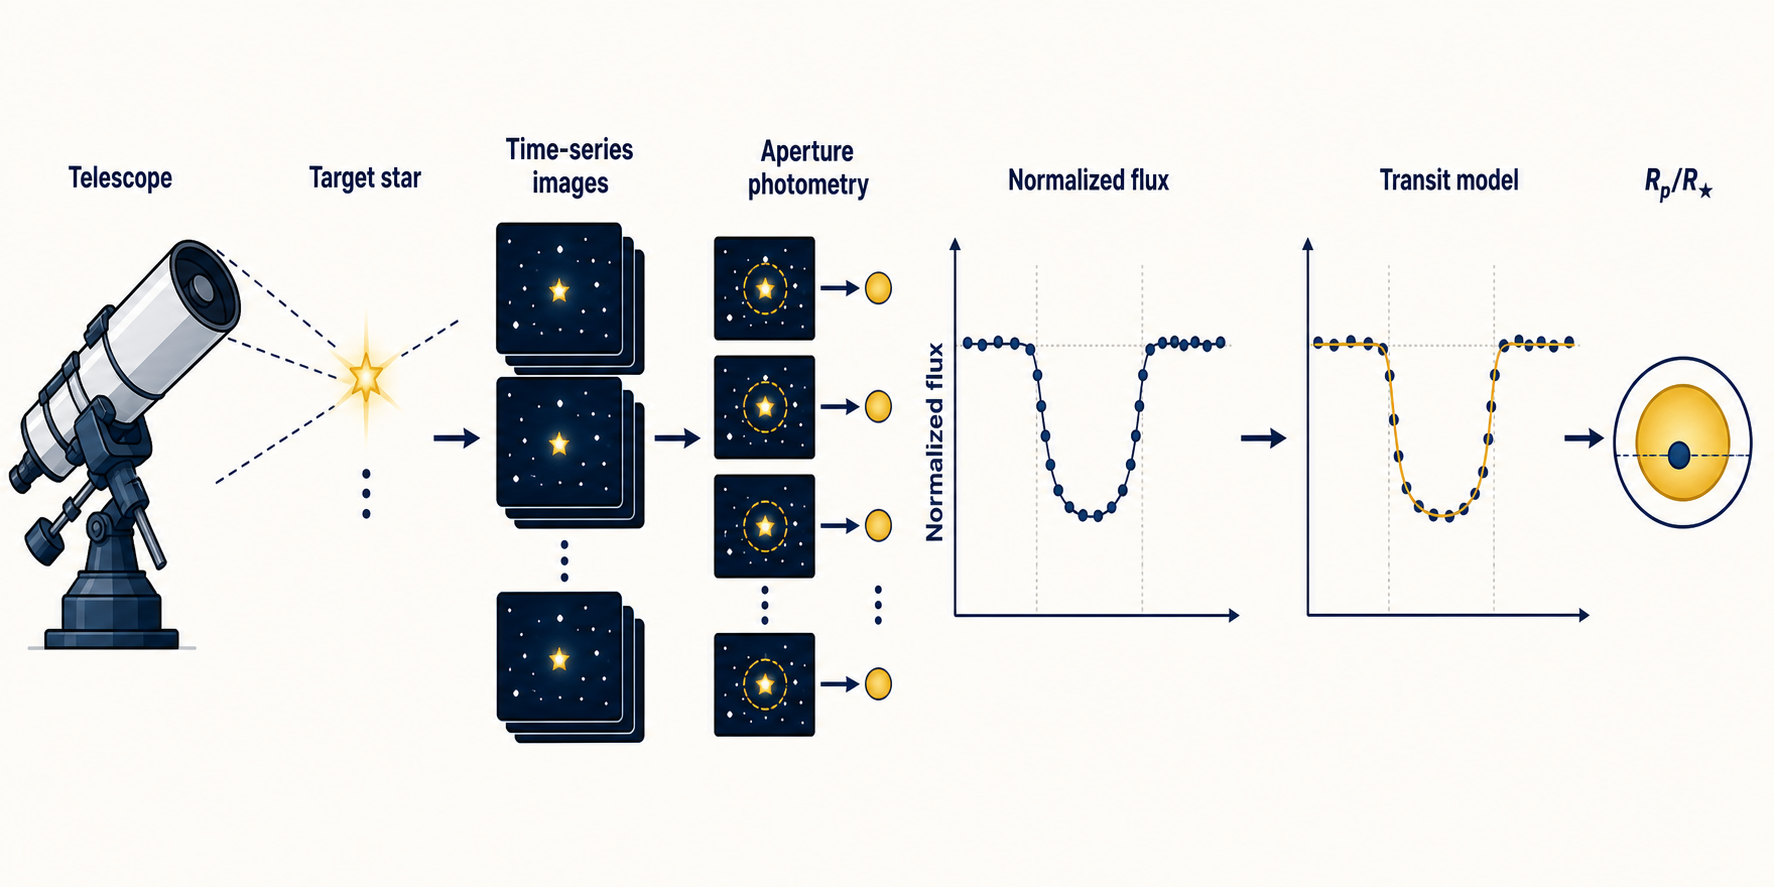
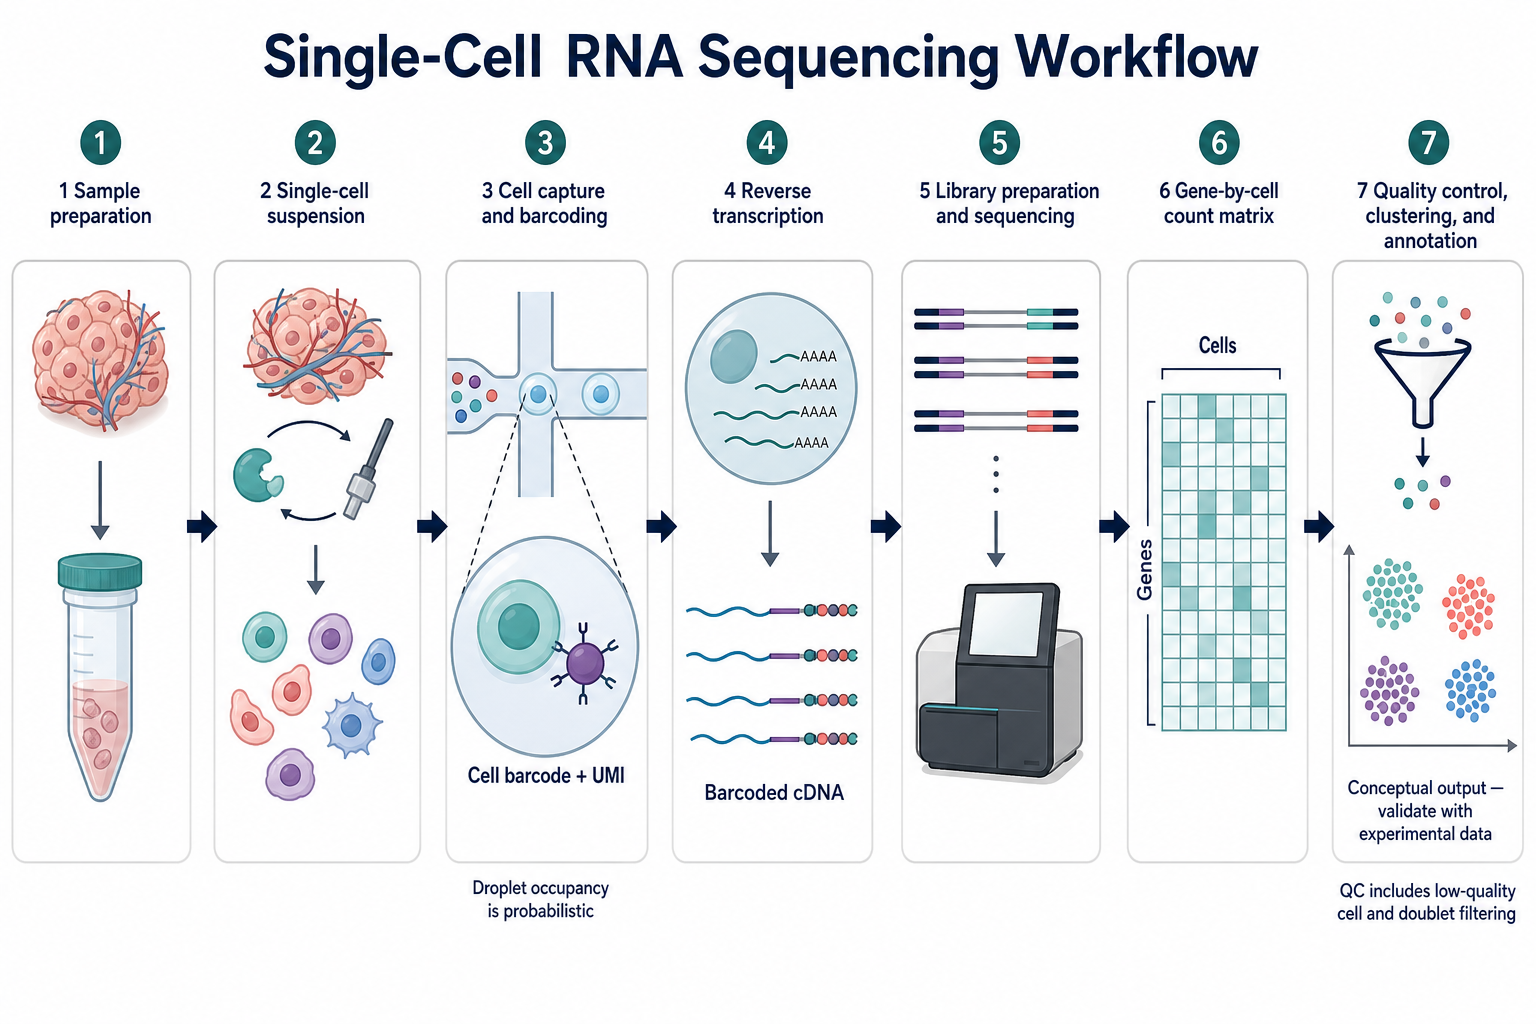
- Experimental or analytical workflows
- Conceptual comparisons between conditions
Use validated specialist tools for
- Detailed quantitative result panels
- Raw or processed microscopy evidence
- Statistical plots that require exact values
- Journal templates requiring editable vector assets
Step by step
Build the visual story in seven steps
Do the editorial work before the illustration work. A clear narrative makes layout, prompting, and scientific review much easier.
- 01
Write the take-home message
Complete this sentence: “This study shows that…” Keep only the main supported conclusion. If several conclusions compete for attention, decide which one the title and abstract emphasize or create separate communication assets.
- 02
Extract three essential parts
Write one short line for the context or question, one for the decisive approach or mechanism, and one for the primary result. These lines become the content skeleton. Secondary controls and supporting analyses usually belong in the paper, not the visual summary.
- 03
Choose a story shape
Use a horizontal flow for sequence, a central mechanism for one explanatory pathway, a side-by-side comparison for conditions, or a workflow when the method is the contribution. Define the entry point and reading direction explicitly.
- 04
Reduce the visual vocabulary
Assign one visual form to each role: samples, interventions, processes, and outcomes. Reuse shapes and colors consistently. Avoid realistic laboratory decoration unless it helps readers understand the experimental logic.
- 05
Draft concise labels
Use terminology that matches the manuscript but shorten phrases where possible. Labels should identify components and outcomes, not reproduce paragraphs from the abstract. Keep abbreviations consistent and define any term an interdisciplinary reader may not know.
- 06
Generate or assemble the first version
Write a prompt that lists the required scientific elements, relationships, layout, labels, and exclusions. Treat the output as a visual draft. Replace incorrect text and redraw any relationship that cannot be verified.
- 07
Review against the paper and journal
Compare the graphical abstract with the manuscript abstract, main figures, and conclusions. Then check the target journal’s size, file format, permissions, originality, and generative-AI requirements before export.
Decision guide
Choose a graphical abstract layout
The layout is a claim about how the parts of the study relate. Select it before choosing icons, colors, or rendering style.
| Choice | Best for | Watch for |
|---|---|---|
| Question → method → finding | Studies with a clear experimental sequence and one outcome | Do not turn the method panel into a full protocol |
| Central mechanism | One pathway or interaction that explains the outcome | Separate established links from hypotheses |
| Before vs. after | Intervention, treatment, or condition comparisons | Keep scale, viewpoint, and labels comparable |
| Input → workflow → output | Methods, platforms, pipelines, and analytical contributions | Show only stages needed to understand the contribution |
Prompt library
Graphical abstract prompt examples
Describe the scientific story and reading order before asking for a flat illustration or polished rendering.
Three-part research story
A concise graphical abstract for a study of nanoparticle drug delivery to tumor cells. Show three left-to-right panels: targeted nanoparticle uptake by tumor cells, intracellular drug release, and reduced tumor growth. Use short labels, a restrained blue and teal palette, consistent cell shapes, a white background, and one clear reading direction. Do not add numerical results or mechanisms not specified.
Mechanism-centered abstract
A flat scientific graphical abstract showing how inhibition of the MAPK pathway reduces downstream transcription and cell proliferation. Place the signaling pathway in the center, the inhibitor and treatment context on the left, and the supported cellular outcome on the right. Use precise arrows, concise labels, limited color coding, and no decorative molecular structures.
Common mistakes
Problems to catch before export
Trying to include the whole paper
A graphical abstract loses its purpose when every assay, control, and secondary finding competes for attention.
Choosing icons before the story
A collection of attractive scientific symbols does not create a narrative. Establish the relationship and reading order first.
Using arrows as decoration
Each arrow implies sequence, movement, transformation, or causality. If the manuscript does not support that relationship, remove or change it.
Writing too much text
Long labels make the visual behave like a slide. Move explanation to the caption or paper and keep only identification and essential outcomes.
Submitting without a policy check
Publisher-level guidance is not always identical to the target journal. Review the journal’s current instructions before submission.
Final scientific review checklist
- 01The visual communicates one take-home message.
- 02Question, approach, and finding match the manuscript abstract.
- 03The reading direction is obvious without explanatory prose.
- 04Arrows and visual comparisons do not overstate the evidence.
- 05Labels, conditions, organisms, and outcomes use manuscript terminology.
- 06The image remains clear at the required journal dimensions.
- 07Originality, permissions, disclosure, and AI-image requirements are satisfied.
Further reading
Sources and publication guidance
Publisher and journal requirements change. Use these sources as a starting point, then check the instructions for the exact journal receiving your submission.