01
Publication-Ready Figures
Every figure is generated at publication quality with clean lines and sharp labels, ready for journals, posters, and theses.

 5 free figures
 Describe your research. Get a publication-ready scientific figure with a clean legend and reference labels — in under a minute.
Free tool
Write the message, describe each panel, and define symbols and statistics. The legend is assembled in your browser as you type; nothing is sent.
Your legend appears here as you type.
Need the figure itself?
Describe it in the generator aboveTrusted by researchers from leading institutions worldwide













Every figure is generated at publication quality with clean lines and sharp labels, ready for journals, posters, and theses.
Your figure comes with a structured, journal-style figure legend — no more writing captions by hand or chasing formatting rules.
Verify a new account for 5 free figures, then generate and refine figures with any available model.
How it works
Type or paste your research description: mechanism, pathway, workflow, or data visualization idea.
Choose line art, 3D render, or flat design. Toggle legend and reference labels on or off.
Mark any area that needs work and describe the change. When the figure is right, save it and choose the export you need.
Legend structure
A good legend does more than name the objects in an image. It explains the scientific reading order, defines visual conventions, and gives readers enough context to interpret the figure without searching through the manuscript. Ask for the visual structure you need, then verify the finished wording against the actual study before publication.
Open with one sentence that identifies what the figure shows and why the relationship matters. Name the system, intervention, comparison, or workflow without repeating the manuscript title. A useful legend helps a reader understand the figure independently, but it should not introduce a new conclusion that the data do not support. Keep the opening descriptive and reserve interpretation for the final sentence only when the evidence justifies it.
Explain panels in reading order and define every abbreviation, color, line style, arrow type, and symbol that is not universally understood. If panels A–D show different methods or conditions, say so directly instead of making readers infer the mapping. Keep the wording parallel across panels, and use the same terminology as the labels inside the image. This is especially important when a figure combines a mechanism, experimental workflow, and quantitative result.
Include the experimental conditions required to interpret the figure: sample identity, treatment, time point, temperature, scale, units, normalization, or statistical notation when relevant. Do not copy the entire methods section into the legend. For a conceptual diagram, clearly describe it as a schematic rather than implying that arrows, dimensions, or intensities are measured values. Exact conditions should come from the study record, not from the image generator.
A figure legend should distinguish what is visually encoded from what the authors conclude. Describe solid and dashed arrows, groups, controls, and outcomes first. Then add a concise interpretation only if the journal format calls for it. Avoid causal verbs when the experiment shows association, and avoid claiming significance unless the statistical comparison is present and defined. This separation makes the figure easier to review and reduces the risk of an illustration overstating the research.
Key features
— from text description to diagram in seconds
— journal-style captions generated with your figure
— clean annotations for methods, mechanisms, and workflows
— line art, 3D, and flat design
— print-quality output for journals and posters
— 10 credits at 1K and 20 credits at 2K
Annotation guidance
Useful labels connect a visual element to a precise scientific meaning. They may identify a structure, define an arrow, record a parameter, or point readers to a source note. Include these requirements in the description before generating, then check every callout at full size so a polished layout does not conceal an incorrect connection.
For a mechanism or pathway, reference labels should identify the exact molecule, complex, compartment, material, or state being discussed. Define whether an arrow represents activation, inhibition, conversion, binding, transport, or a proposed relationship. Use consistent names across the figure, legend, and manuscript, and avoid adding a component simply because it is common in a textbook pathway. When evidence is indirect, words such as “proposed” or “associated with” are more accurate than a definitive causal label.
Workflow labels should make the sequence auditable. Number the steps, identify the input and output of each stage, and add parameters such as duration, temperature, flow rate, concentration, or instrument mode only when they are known and relevant. Use branches for genuine decisions or parallel analyses, not as decoration. For apparatus figures, connect callouts to the correct port, chamber, sensor, or measurement zone and keep directional arrows consistent with the physical process.
A reference label inside an image is not a substitute for a bibliographic citation. If a mechanism, structure, or workflow is adapted from previous work, place the citation in the manuscript or figure legend according to the target journal’s style. Identify whether the figure is original, adapted, or reproduced, and obtain permission when required. Keep source notes separate from panel labels so readers can distinguish scientific annotation from publication attribution.
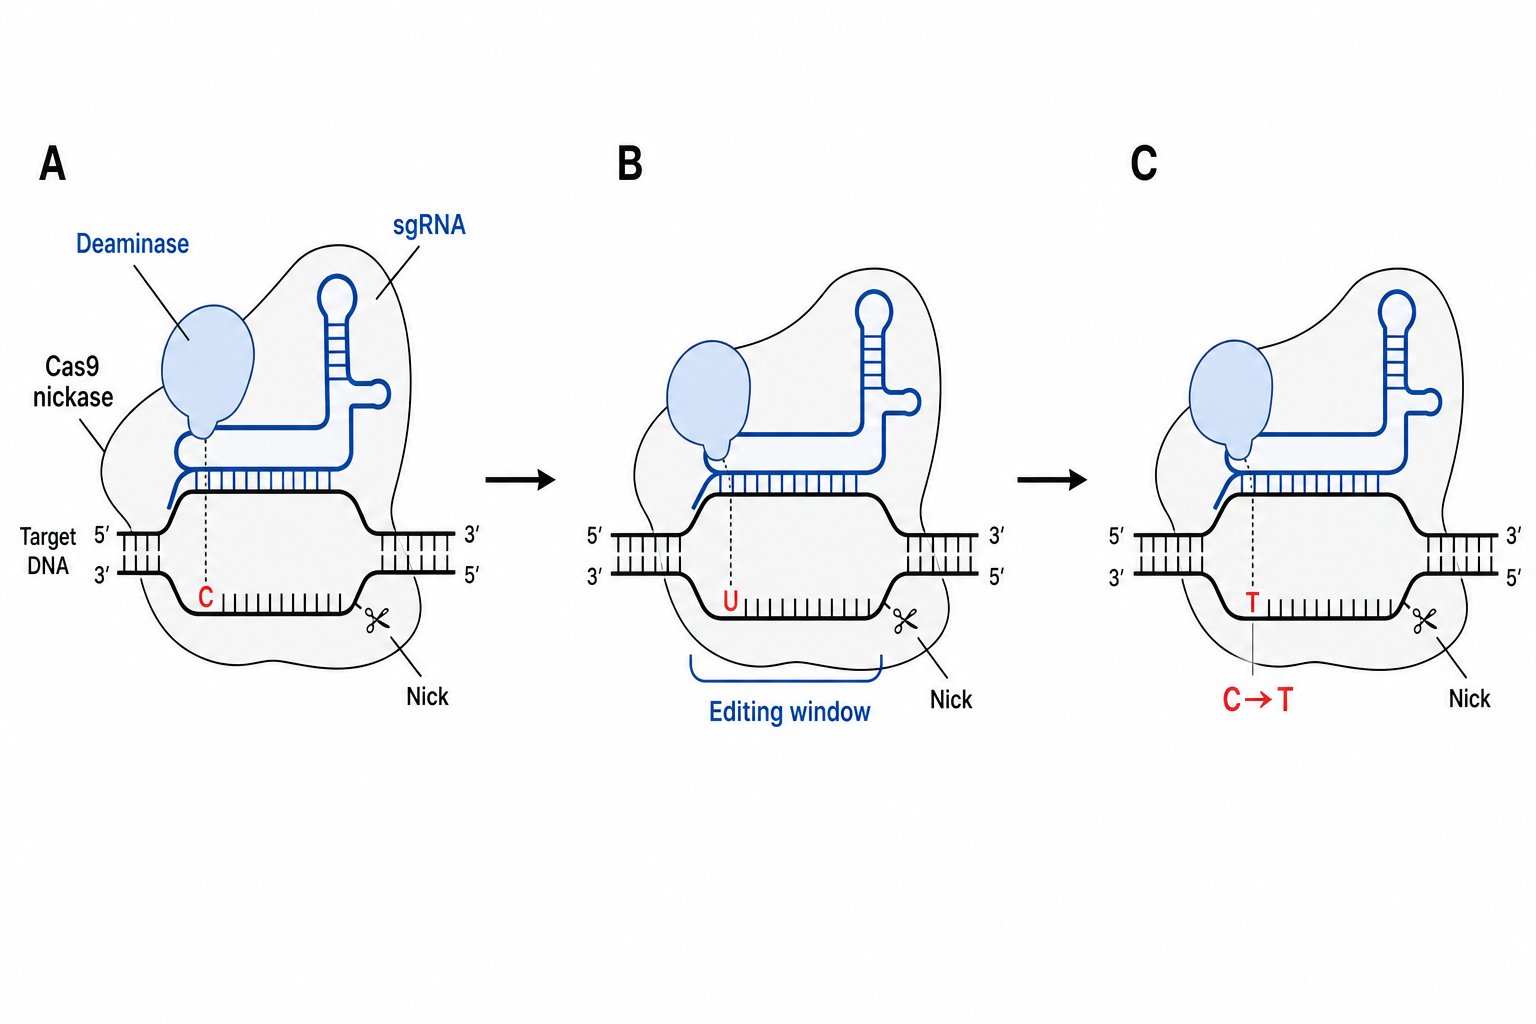
CRISPR cytosine base editing
Figure 1. CRISPR cytosine base editing through Cas9 nickase targeting, deamination, and C-to-T conversion.
"Create a publication-ready CRISPR cytosine base-editing mechanism with reference labels"
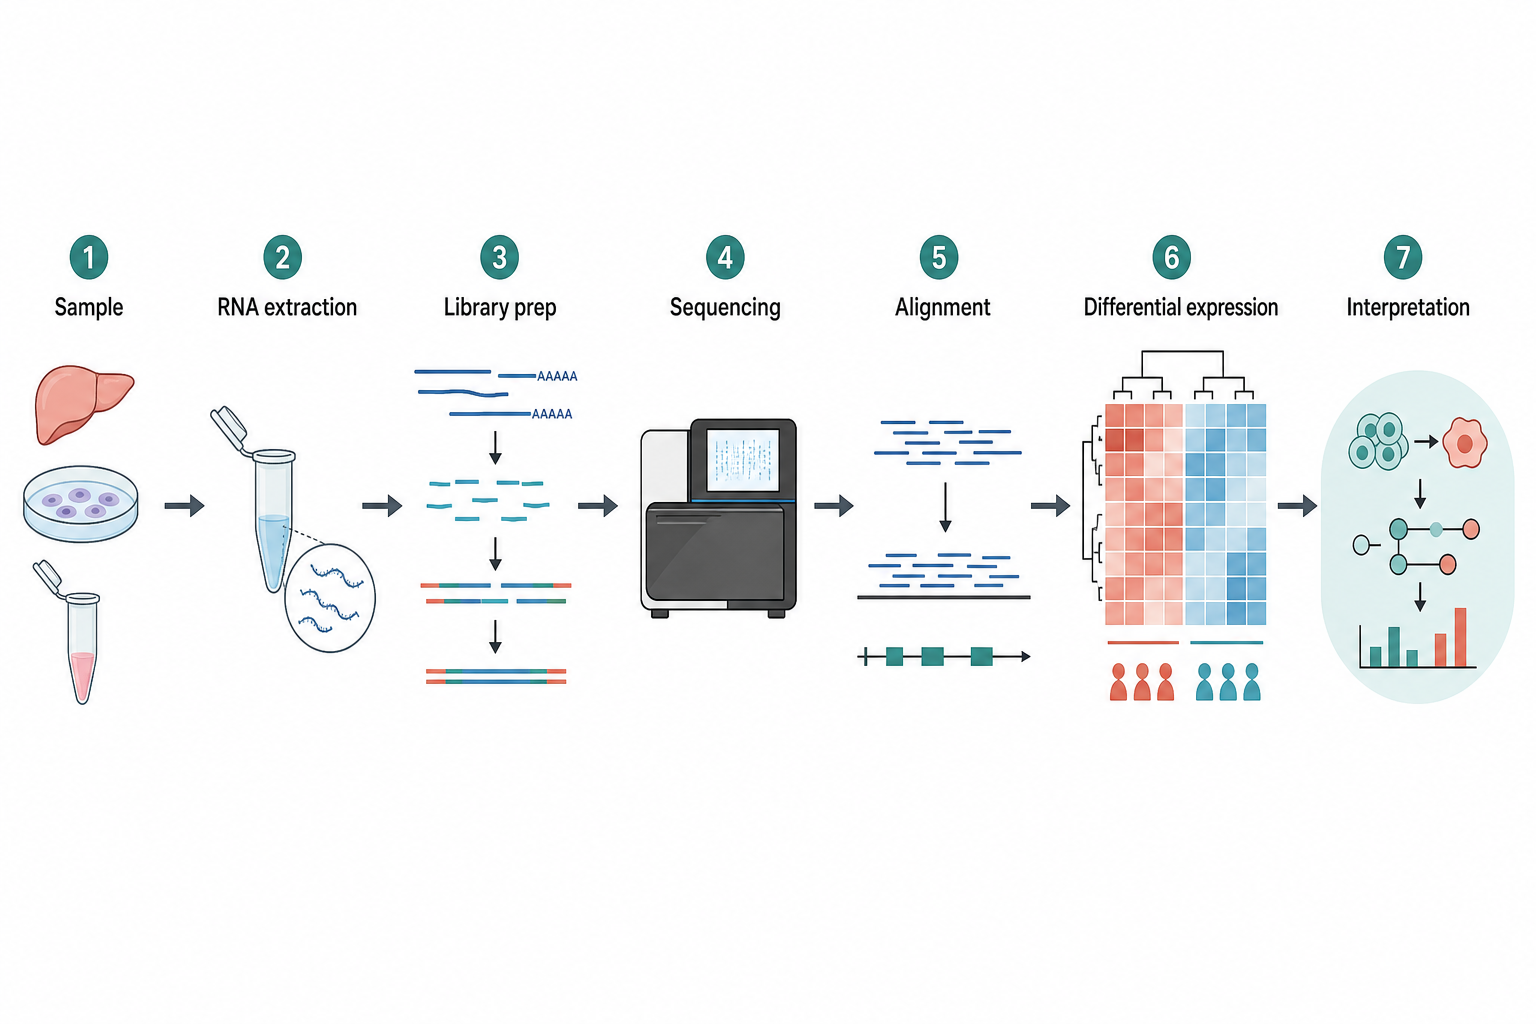
RNA-seq workflow
Figure 2. RNA-seq workflow from sample collection and library preparation through differential expression and interpretation.
"Create an RNA-seq workflow figure with numbered steps and legend"
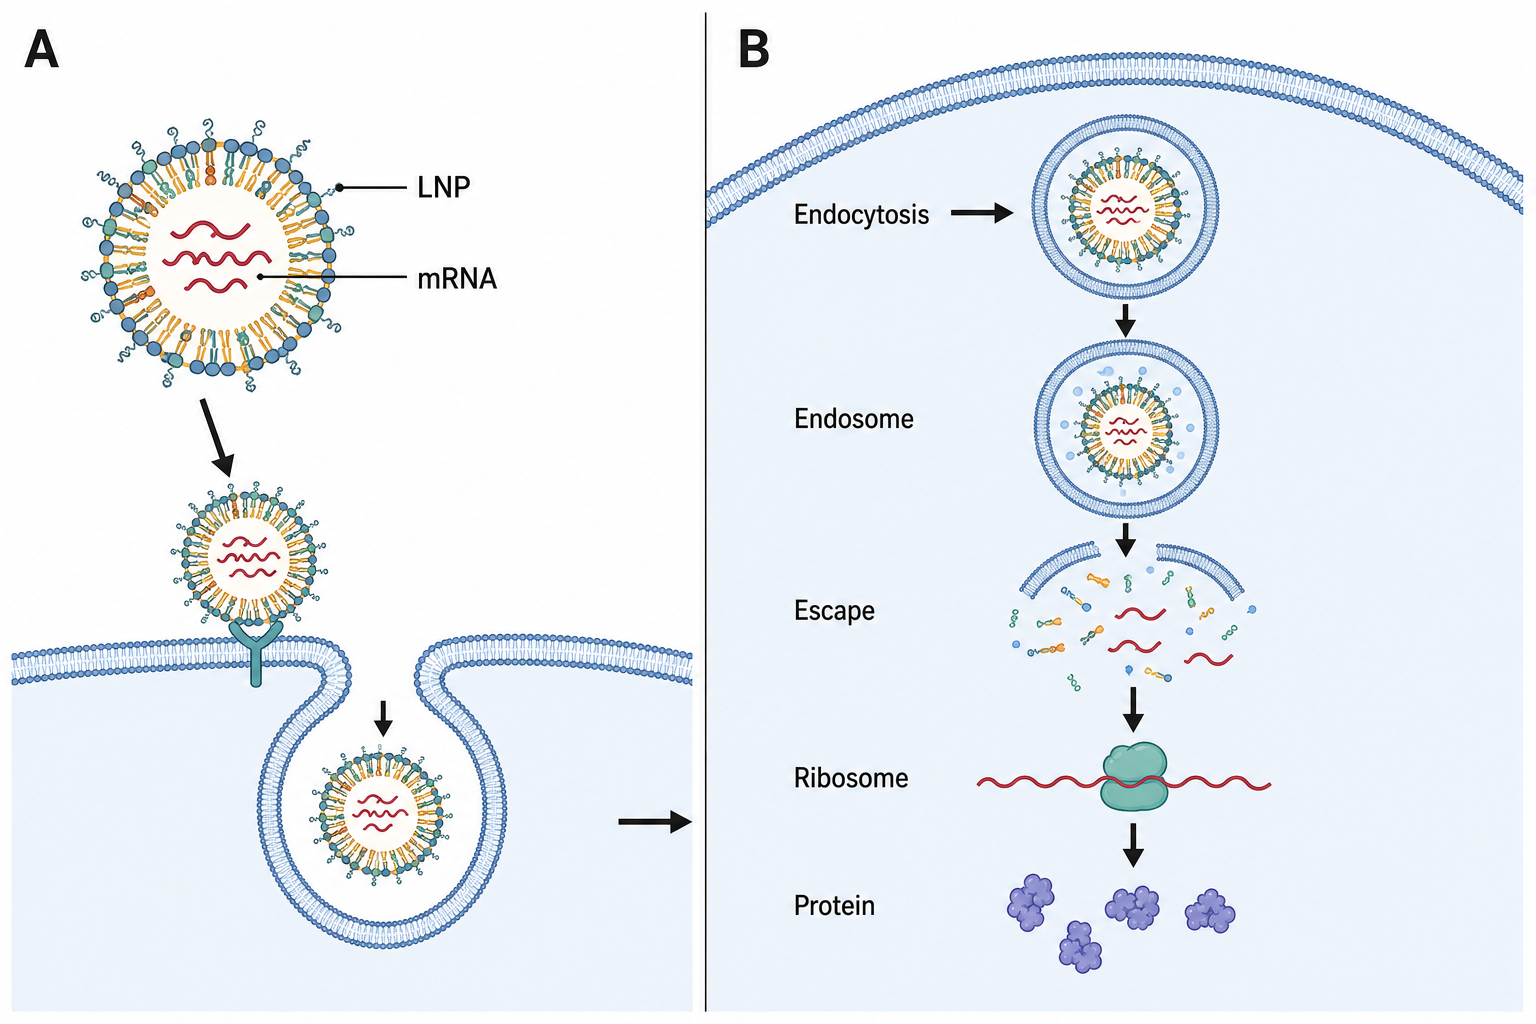
LNP mRNA delivery
Figure 3. Lipid nanoparticle uptake, endosomal escape, mRNA release, ribosomal translation, and protein production.
"Create a lipid nanoparticle mRNA delivery figure with panel labels and legend"
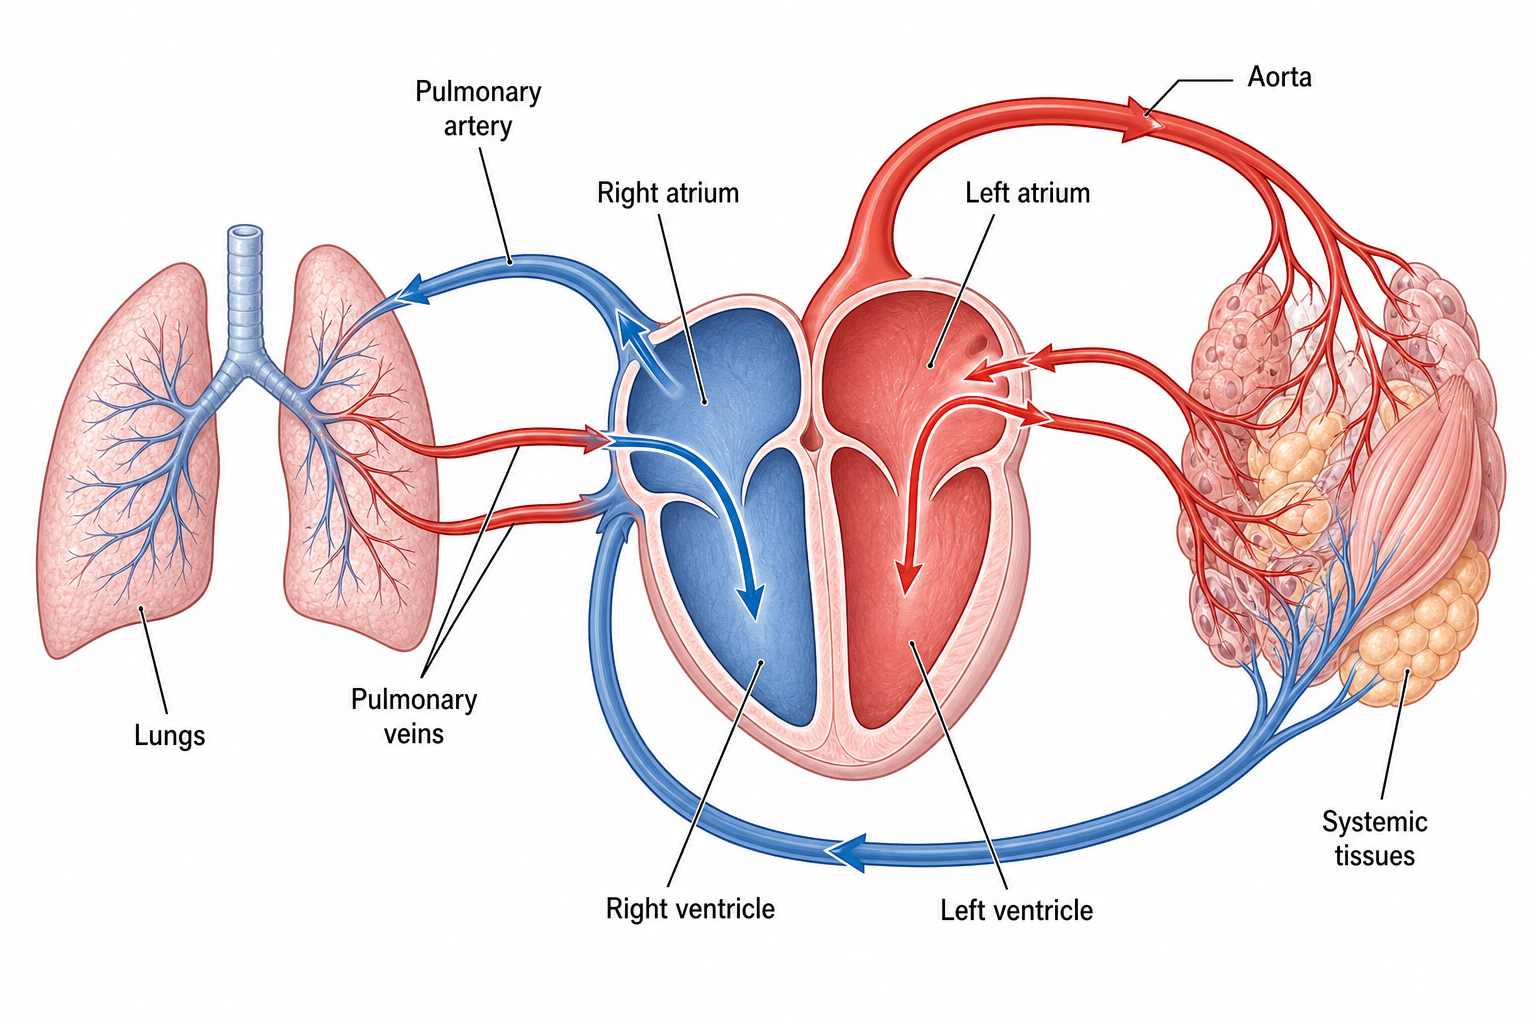
Pulmonary and systemic circulation
Figure 4. Deoxygenated blood passes through the right heart and pulmonary circuit; oxygenated blood returns to the left heart and systemic circuit.
"Create a labeled pulmonary and systemic circulation figure with flow directions and explanatory legend"
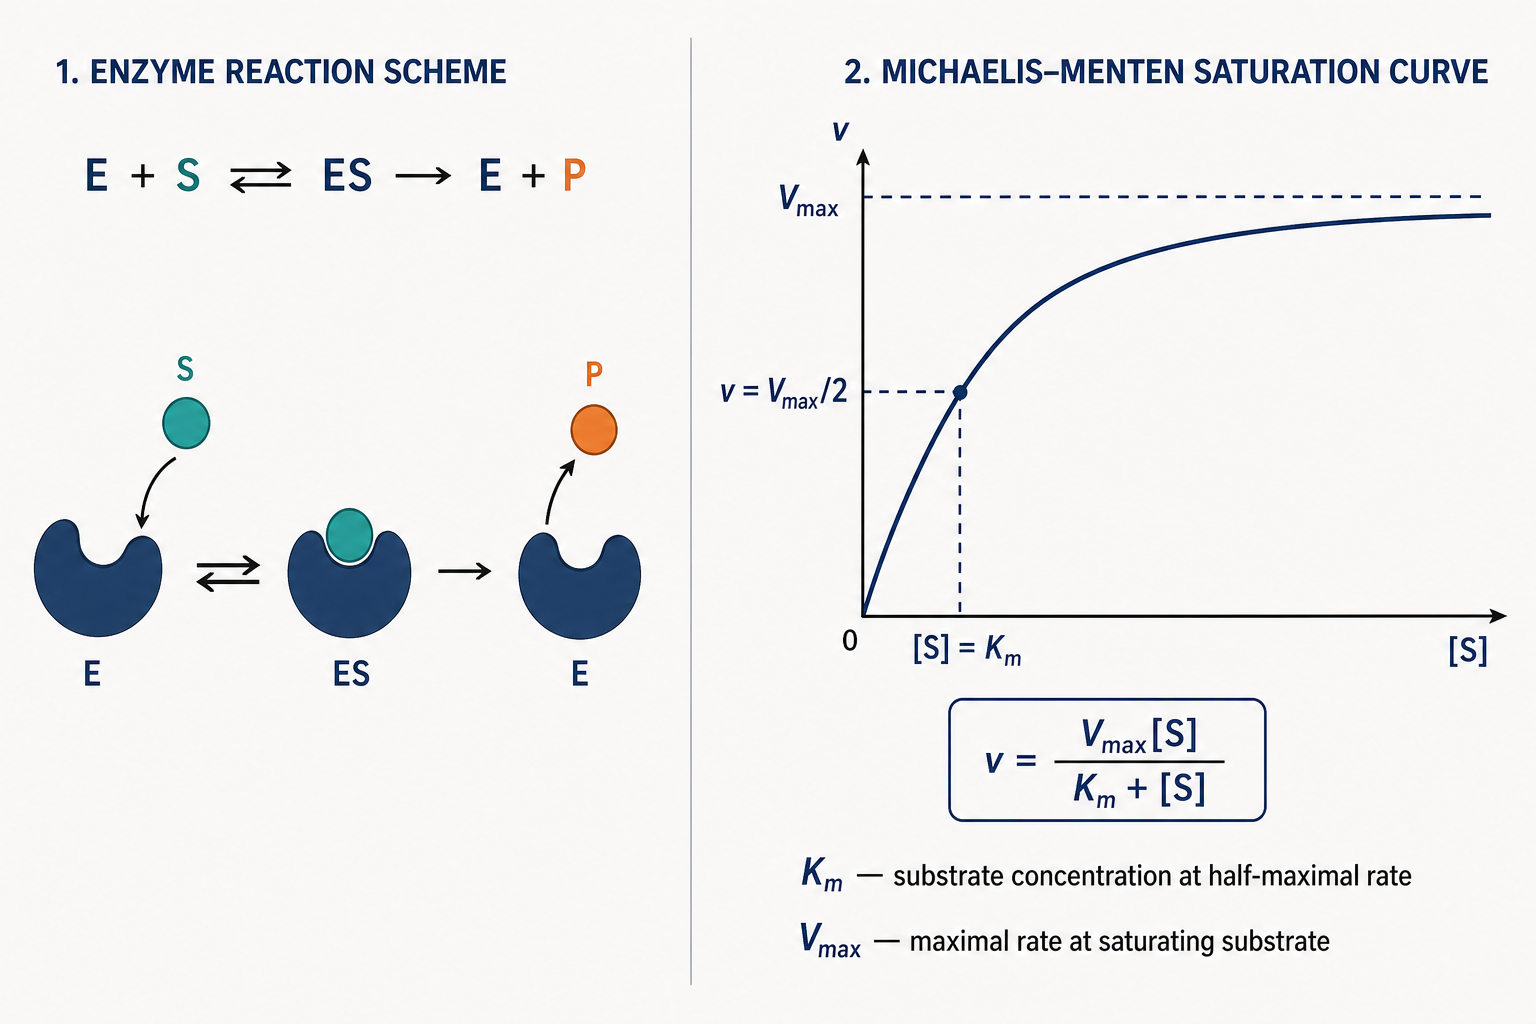
Michaelis-Menten enzyme kinetics
Figure 5. Initial reaction velocity approaches Vmax as substrate concentration increases; Km is the substrate concentration at half-maximal velocity.
"Create a Michaelis-Menten kinetics figure with Vmax, Km, equations, parameter definitions, and legend"
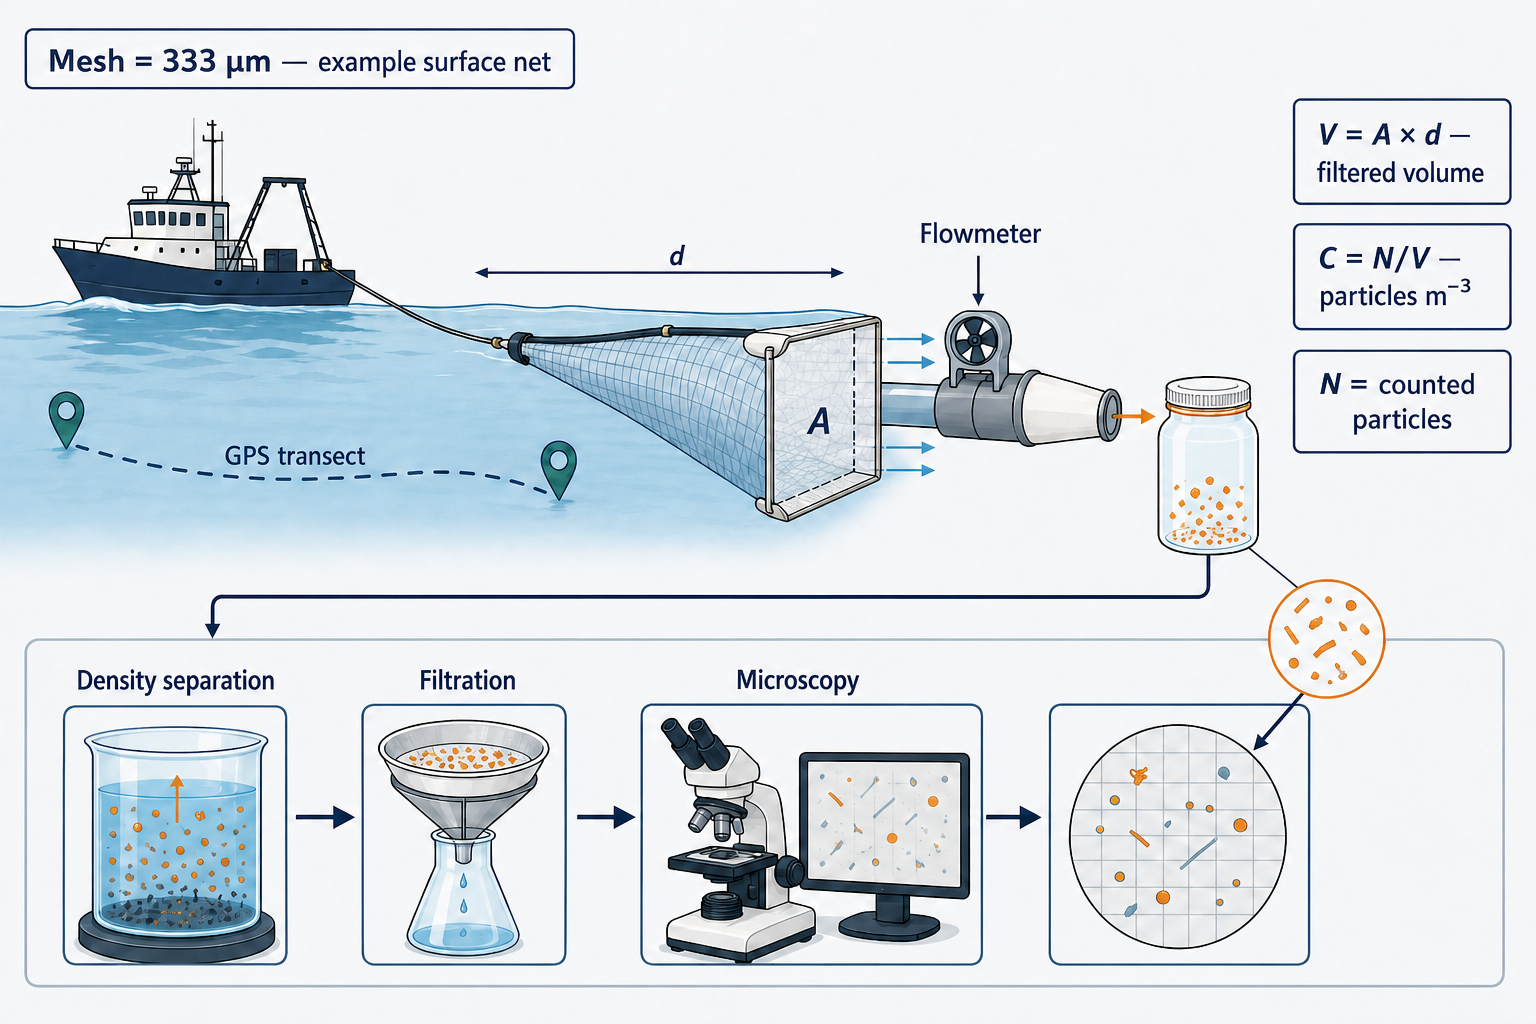
Ocean microplastic sampling
Figure 6. Surface-water sampling, size fractionation, particle counting, and spectroscopic polymer identification with recorded sampling parameters.
"Create an ocean microplastic sampling workflow with station metadata, mesh size, particle counts, and polymer analysis labels"
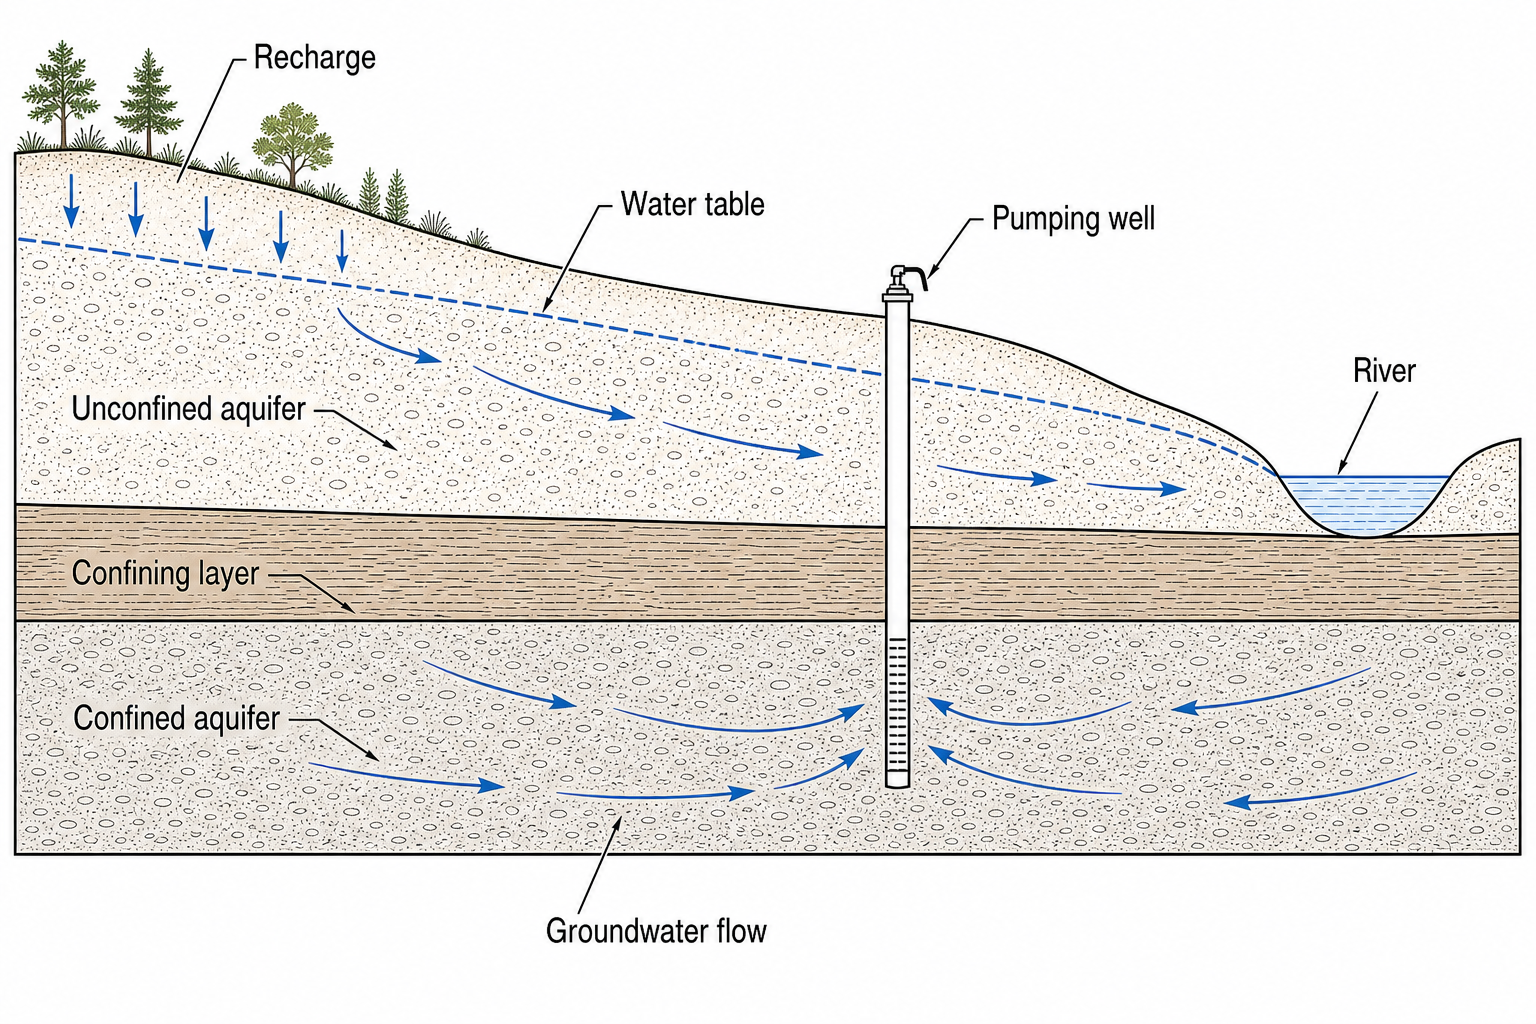
Confined and unconfined aquifers
Figure 7. Recharge, groundwater flow, water-table position, confining layers, and potentiometric head in confined and unconfined aquifer systems.
"Create a hydrogeology cross-section with aquifer types, hydraulic heads, well screens, flow arrows, and reference labels"
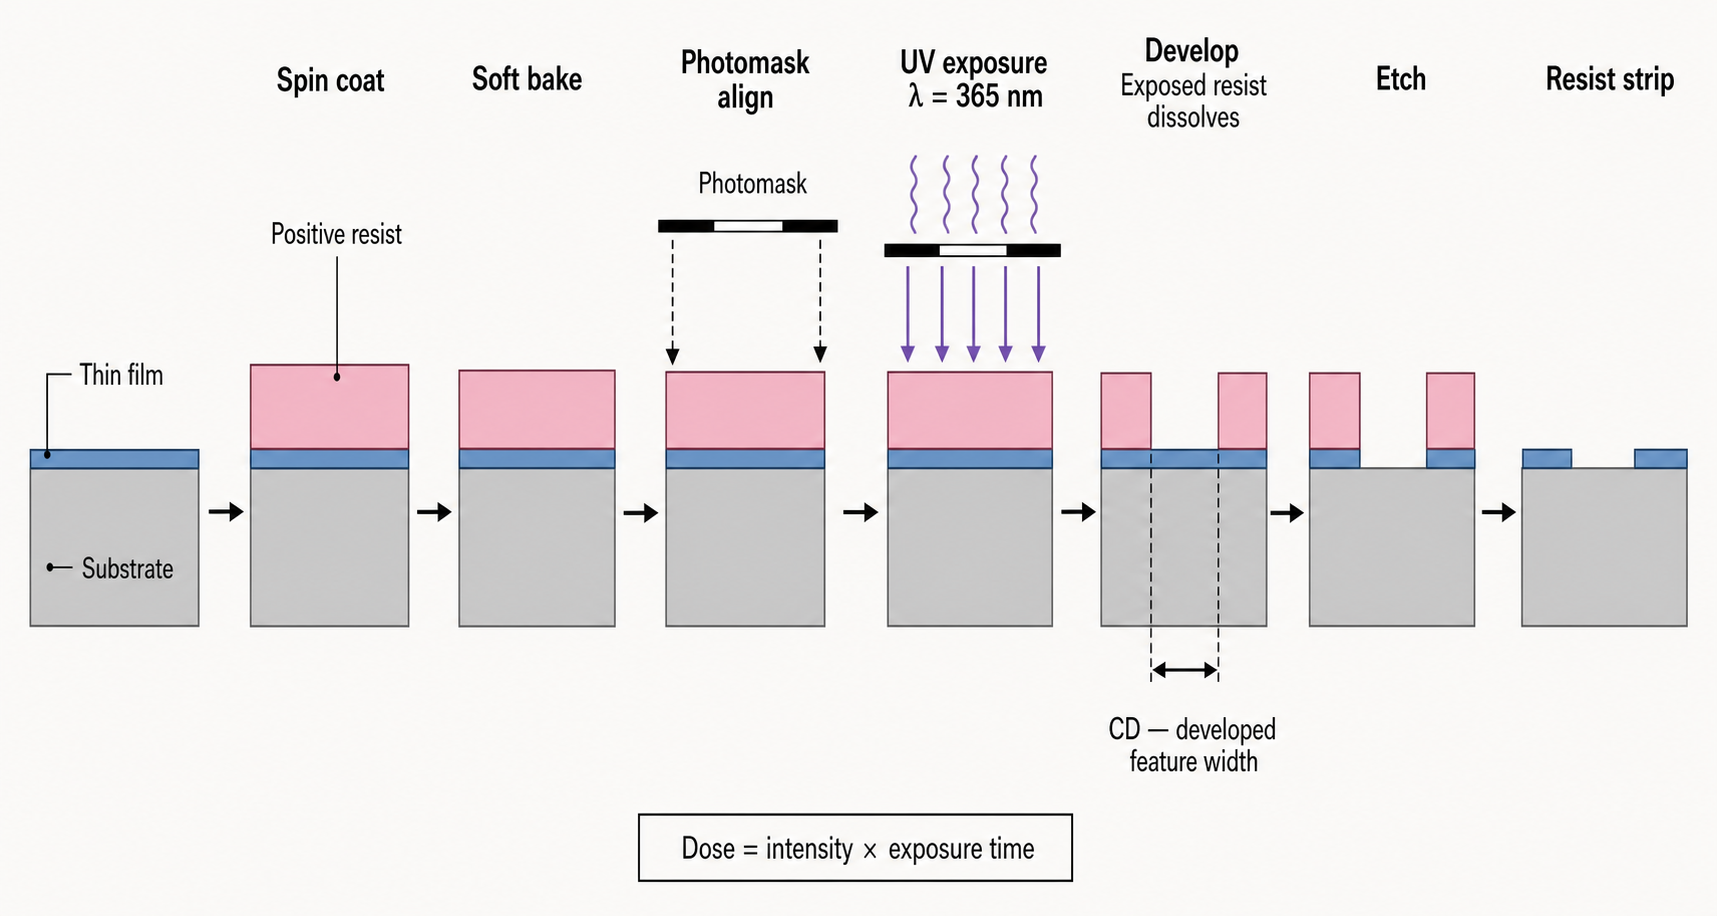
Positive-resist photolithography
Figure 8. Positive-resist pattern transfer from spin coating and soft bake through ultraviolet exposure, development, etching, and resist stripping.
"Create a positive-resist photolithography process figure with numbered steps, process conditions, and a concise legend"
Every example above was generated from the shown research description — type your own and create a figure for your study.
— journal-quality main figures and supplementary diagrams
— one-glance visual summaries with clean legends
— conference-ready visuals that explain themselves
— consistent, publication-style figures across chapters
FAQ
It's an AI tool that turns your research description into a publication-ready scientific figure, complete with a clean legend and reference labels — so you don't have to hand-draw diagrams or write captions from scratch.
Yes. Toggle on the legend option and the tool generates a journal-style figure legend together with your figure, formatted to match common publication guidelines.
New verified accounts receive 5 free figures: 3 at signup, 2 more the next day. Each successful 1K generation or edit uses 10 credits, and each successful 2K result uses 20 credits. Downloads are included.
Every successful 1K or 2K result in your account includes a PNG download without a separate unlock charge. The current editor does not export editable SVG.
Yes. Figures generated with this tool are intended for publication use. Always check your target journal's figure guidelines for specific formatting requirements.
Three styles are available: line art, 3D render, and flat design. You can switch styles before generating your figure.
Mechanism diagrams, pathway figures, workflows, graphical abstracts, and other scientific diagrams — describe what you need and the AI will build it.
You don't need to cite the tool for generated figures, but check your institution's and journal's AI usage policies to stay compliant.
Turn your research description into a publication-ready figure with signup credits and an optional legend.
Generate Your Figure