

How to Make Scientific Figures for Publication
Publication workflow
Plan, draft, review, and prepare a scientific figure for a paper without confusing explanatory illustration with measured data.
Scientific figure generator
Draft the first version here
Start from the plan this guide describes: one claim, one layout, precise labels. Review the result against the checklist below.
3 free figures for new accounts, no card. Downloads have no watermark.
Short answer
Start with the scientific message
Start by writing the one scientific relationship the figure must communicate. Choose a figure type that matches the evidence, sketch the reading order, list every required label and connection, and only then select the software or generation method.
Use an AI figure generator for explanatory diagrams such as mechanisms, workflows, apparatus schematics, and conceptual overviews. Use analysis or imaging software for quantitative plots, microscopy, spectra, and other measured outputs. Whatever the tool, verify the final figure against the source data, manuscript, and target journal instructions.
- The figure type should follow the evidence, not the visual style you prefer.
- A generated illustration is a draft until every label, arrow, structure, and implied claim is checked.
- Prepare the figure at its intended publication size and follow the instructions of the specific journal.
Scope first
Choose the tool that matches the evidence
Explanatory illustration and measured evidence are different jobs. Keep that boundary visible throughout the workflow.
Use this generator for
- Mechanism and pathway diagrams
- Experimental or analytical workflows
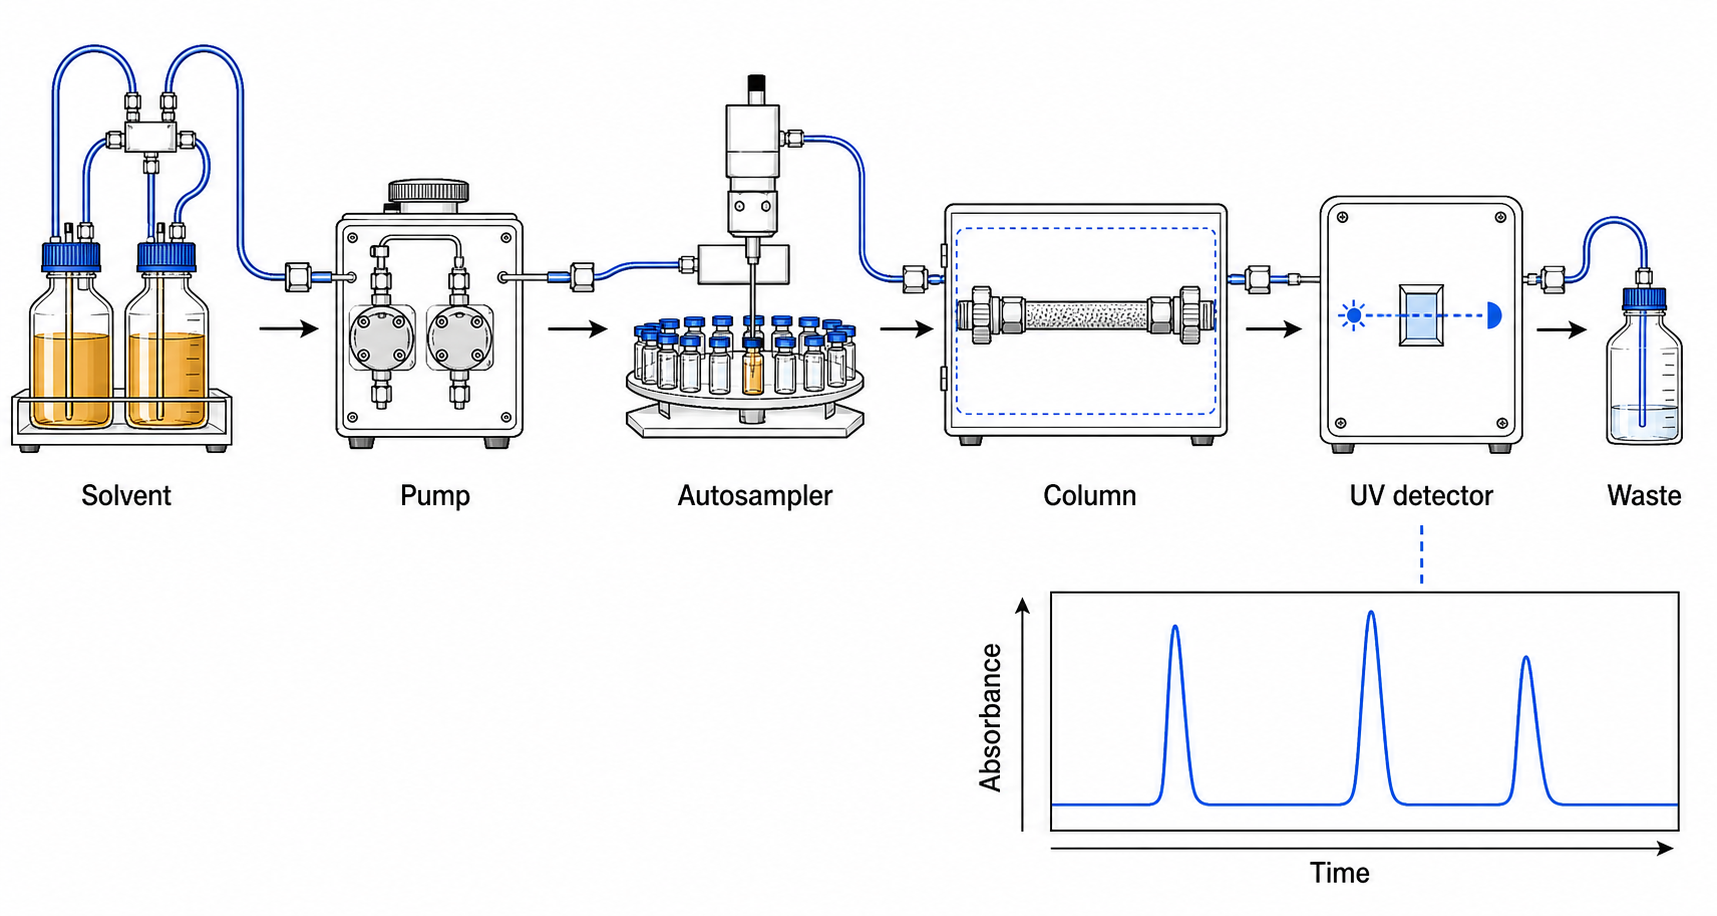
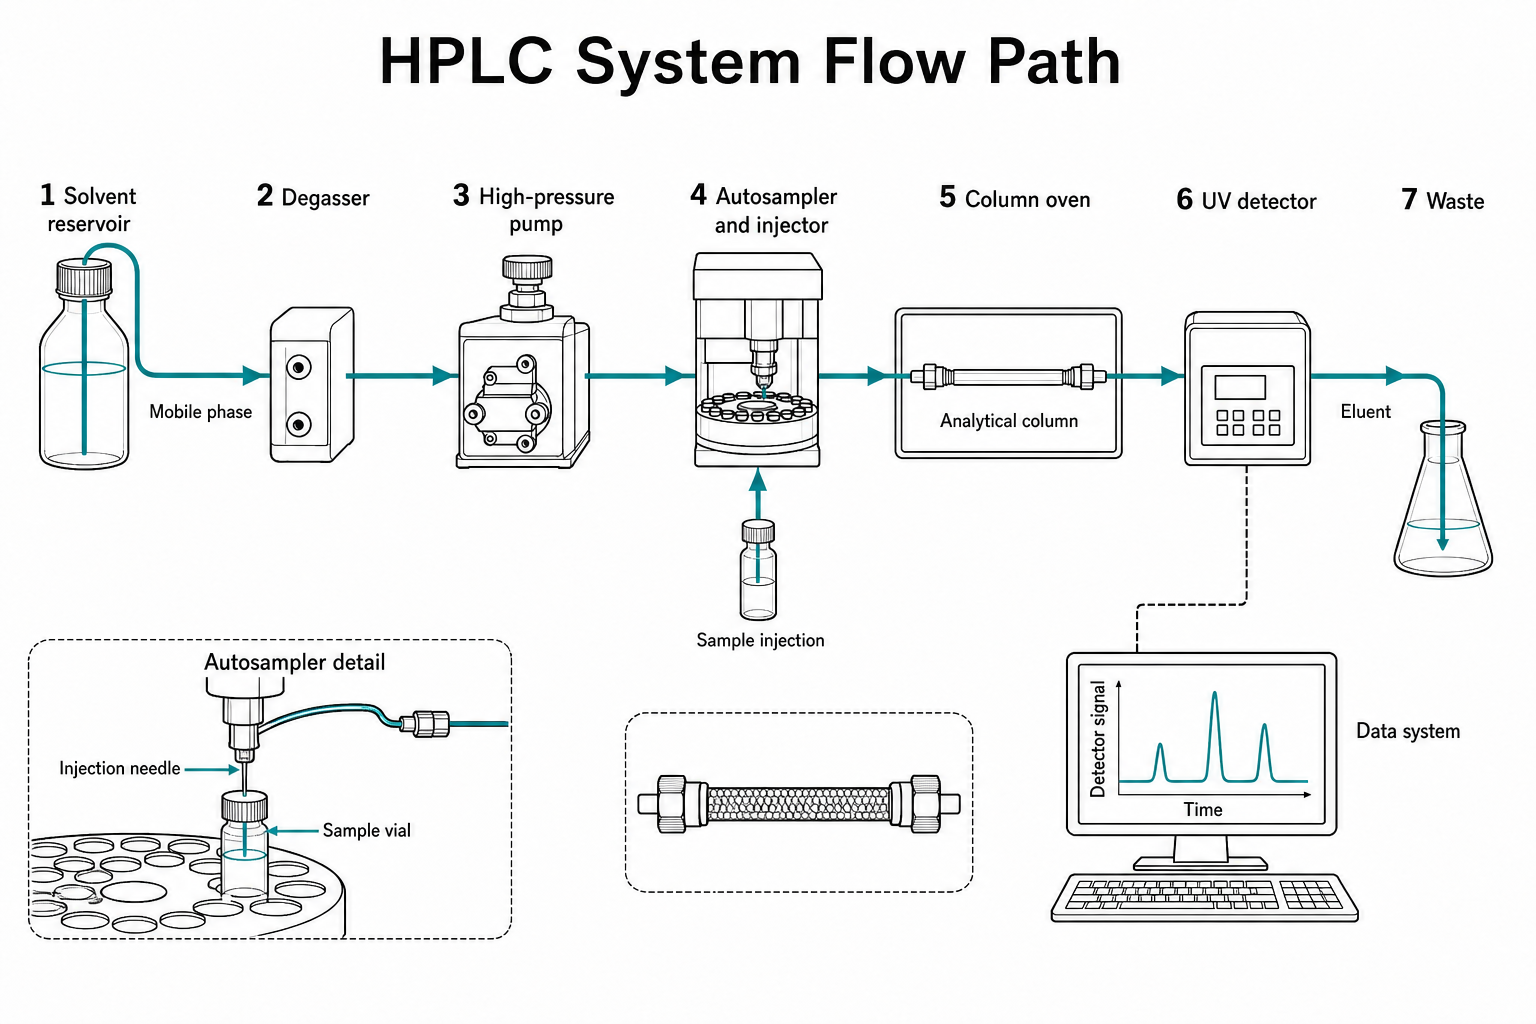
- Apparatus and device schematics
- Conceptual structural overviews
Use validated specialist tools for
- Statistical plots and measured data
- Microscopy and medical images
- Spectra, gels, and quantitative panels
- Exact atomic or anatomical models
Step by step
A publication workflow in eight passes
A strong figure usually comes from a sequence of small decisions. Keeping those decisions separate makes the visual easier to review and revise.
- 01
Write the figure’s job in one sentence
State what a reader should understand after viewing the figure. A useful sentence names the subject and relationship: for example, “show how the intervention changes the signaling pathway and measured outcome.” If the sentence contains several unrelated messages, split the figure or remove secondary content.
- 02
Choose the evidence-appropriate figure type
Use a plot for numerical comparison, a microscopy panel for observed images, a schematic for mechanisms or apparatus, and a workflow for sequence. Do not turn measured data into a decorative illustration, and do not present a generated image as if it were an observation.
- 03
Define the evidence boundary
List which relationships are measured, established by prior work, hypothesized, or included only for context. This boundary controls arrows, labels, and emphasis. It also prevents the image from implying causality or precision that the manuscript does not support.
- 04
Sketch the reading order
Choose a left-to-right sequence, top-to-bottom process, central mechanism, comparison, or cutaway. Use boxes and arrows before adding detail. The first sketch should make the entry point, direction, and outcome obvious without relying on color or decoration.
- 05
Write a compact figure specification
Name the required components, exact labels, relationships, exclusions, viewpoint, aspect ratio, and final context. For a generated schematic, this specification becomes the prompt. For a manually assembled figure, it becomes the production checklist.
- 06
Draft with the right tool
Generate or draw explanatory elements, create plots from the original analysis, and preserve editable source files where possible. Work at the intended layout rather than building an oversized figure and hoping it remains legible after reduction.
- 07
Review the science before polishing
Compare every term, arrow, structure, condition, group, scale, and direction with the manuscript and source material. Ask a collaborator to describe what the figure appears to claim. Fix scientific ambiguity before adjusting shadows, colors, or spacing.
- 08
Prepare the submission version
Check the current author instructions for dimensions, file format, editable text, color mode, accessibility, and disclosure requirements. Preview at final size and keep the prompt, source references, and editable working file with the research record.
Decision guide
Match the figure to the information
No single tool or format covers every scientific visual. Use the simplest representation that preserves the evidence readers need to inspect.
| Choice | Best for | Watch for |
|---|---|---|
| Quantitative plot | Measured values, distributions, uncertainty, and comparisons | Generate from the analysis code or validated data—not an image model |
| Microscopy or imaging panel | Observed spatial or morphological evidence | Preserve image integrity, scale bars, and documented processing |
| Mechanism diagram | Components, interactions, and directional relationships | Verify every arrow and avoid unsupported causality |
| Workflow | Methods, sample handling, analysis stages, and outputs | Match the real sequence, branches, and decision points |
| 3D conceptual render | Layering, enclosure, orientation, and device architecture | Do not imply measured geometry or material properties |
Prompt library
Prompt examples for explanatory figures
A useful prompt reads like a figure brief. It describes scientific content first and visual treatment second.
Mechanism diagram
A publication-ready line-art mechanism diagram of DNA replication, showing helicase, primase, DNA polymerase, leading strand, lagging strand, Okazaki fragments, and 5-prime to 3-prime direction labels. Use a left-to-right reading order, precise black strokes, short labels, generous spacing, and a white background. Do not add proteins or interactions that are not listed.
Experimental workflow
A clear flat scientific workflow for an RNA sequencing experiment, showing sample collection, RNA extraction, library preparation, sequencing, quality control, alignment, differential expression analysis, and final interpretation. Organize the steps from left to right with concise labels, restrained blue and teal accents, and no decorative laboratory equipment.
Common mistakes
Problems to catch before export
Starting with a visual style
Choosing 3D, flat, or line art before defining the figure’s job often produces a polished image with the wrong information hierarchy.
Mixing evidence with explanation
Generated elements should not replace plots, microscopy, or other measured outputs, and explanatory arrows should not imply results that were not tested.
Writing labels after generation
Required terminology should be specified and reviewed from the beginning. Late label replacement can introduce inconsistent names or hide layout problems.
Reviewing only at full screen
Text and line weight that look clear on a laptop may fail after the figure is reduced to a journal column.
Treating one journal’s rules as universal
Dimensions, file types, text handling, and AI policies differ. The target journal’s current author instructions are the final authority.
Final scientific review checklist
- 01The figure supports one clear statement in the manuscript.
- 02The chosen format matches the type of evidence being shown.
- 03Every label uses the same terminology as the manuscript.
- 04Every arrow, boundary, scale, and structural relationship is verified.
- 05Colors remain distinguishable and the reading order works without decoration.
- 06Text and essential details remain legible at final publication size.
- 07File format, editable elements, disclosure, and AI-use requirements match the target journal.
Figure size, resolution and fonts by journal
From each publisher's own guide, as checked October 12, 2026. Individual journals can differ, so confirm the current author guide before you export.
| Publisher | Width | Resolution | Text | Files |
|---|---|---|---|---|
| Nature Source | Single column 89 mm, double column 183 mm; at most 170 mm high | Not stated on the figure guide; follow the production instructions you receive | Sans-serif (Helvetica or Arial), 5–7 pt at final size | See the figure guide for accepted file types |
| Elsevier Source | Single column 90 mm, 1.5 columns 140 mm, double column 190 mm | 300 dpi for photos and halftones, 500 dpi for combination art, 1000 dpi for line art | 7 pt at final size; sub- and superscripts at least 6 pt | Check the journal's guide; some Elsevier journals add their own rules |
| PLOS Source | 6.68–19.05 cm wide (13.2 cm to match the text column); at most 22.23 cm high | 300–600 dpi | Arial, Times or Symbol, 8–12 pt | TIFF or EPS only, under 10 MB |
Free tool
Figure pixel size calculator
Pixels needed = width in mm ÷ 25.4 × dpi. Pick a column width and resolution, or enter your image's width to see how large it can print.
You need at least
2,161 pixels across
Scientific Figure Generator exports PNG at 1K or 2K and can upscale 2× for print. Convert to TIFF if your journal requires it.
Which software to use for each kind of figure
Charts and plots from your data
R with ggplot2, Python with Matplotlib, GraphPad Prism
Always plot from the data itself. Export as vector (PDF or EPS) when the journal accepts it, so lines and text stay sharp.
Microscopy, gels and blots
Fiji (ImageJ)
Adjust brightness and contrast across the whole image only, keep the unprocessed originals, and add scale bars. Journals screen these images for manipulation.
Assembling panels and final layout
Inkscape (free), Adobe Illustrator, Affinity Designer
Combine panels, align them, set the final width and font sizes, and add panel letters.
Schematics, mechanisms and workflows
BioRender, Scientific Figure Generator
BioRender builds diagrams from an icon library. Scientific Figure Generator drafts the diagram from a description and lets you change one part by marking it. Neither should be used for data.
Graphical abstracts
Turns your abstract or PDF into a one-panel visual summary after you approve the plan.
Scientific figure examples, and why they work
Explanatory figures made with Scientific Figure Generator. Each one shows a single idea, uses few words and keeps labels outside the busy parts of the drawing.


Questions about publication figures
- What resolution do journals require for figures?
- Commonly 300 dpi for photographs and halftones, 500–600 dpi for figures that mix images and line work, and up to 1000 dpi for line art, all at the final printed size. Elsevier uses 300, 500 and 1000 dpi for these types; PLOS asks for 300–600 dpi. Check your journal's current guide.
- How wide should a figure for a paper be?
- Size it to the journal's column width: about 85–90 mm for one column and 170–190 mm for two (Nature uses 89 and 183 mm; Elsevier 90, 140 and 190 mm). Build it at that size so the font sizes you choose are the ones readers see.
- How many pixels do I need?
- Multiply the width in inches by the dpi: width in millimetres ÷ 25.4 × dpi. For example, a 183 mm double-column figure at 300 dpi needs about 2,161 pixels across.
- What software should I use to make scientific figures?
- Plot data in R, Python or GraphPad Prism; process microscopy in Fiji; assemble panels in Inkscape, Illustrator or Affinity Designer; and draw schematics in BioRender or Scientific Figure Generator. Never use an illustration or AI tool to create data.
- Can I use AI to make figures for a paper?
- Many journals accept AI-assisted schematic illustrations with a disclosure, but not AI-generated data, micrographs or blots, and some journals do not accept AI-generated images at all. Check the policy, review every label, and disclose how the figure was made.
Further reading
Sources and publication guidance
Publisher and journal requirements change. Use these sources as a starting point, then check the instructions for the exact journal receiving your submission.