

Scientific Figure Styles
Visual systems for research communication
Scientific figure generator
Try any style with your own description
Change "line-art" in this example to 3D render or flat illustration and compare the results on the canvas.
5 free figures for new accounts, no card. Downloads have no watermark.
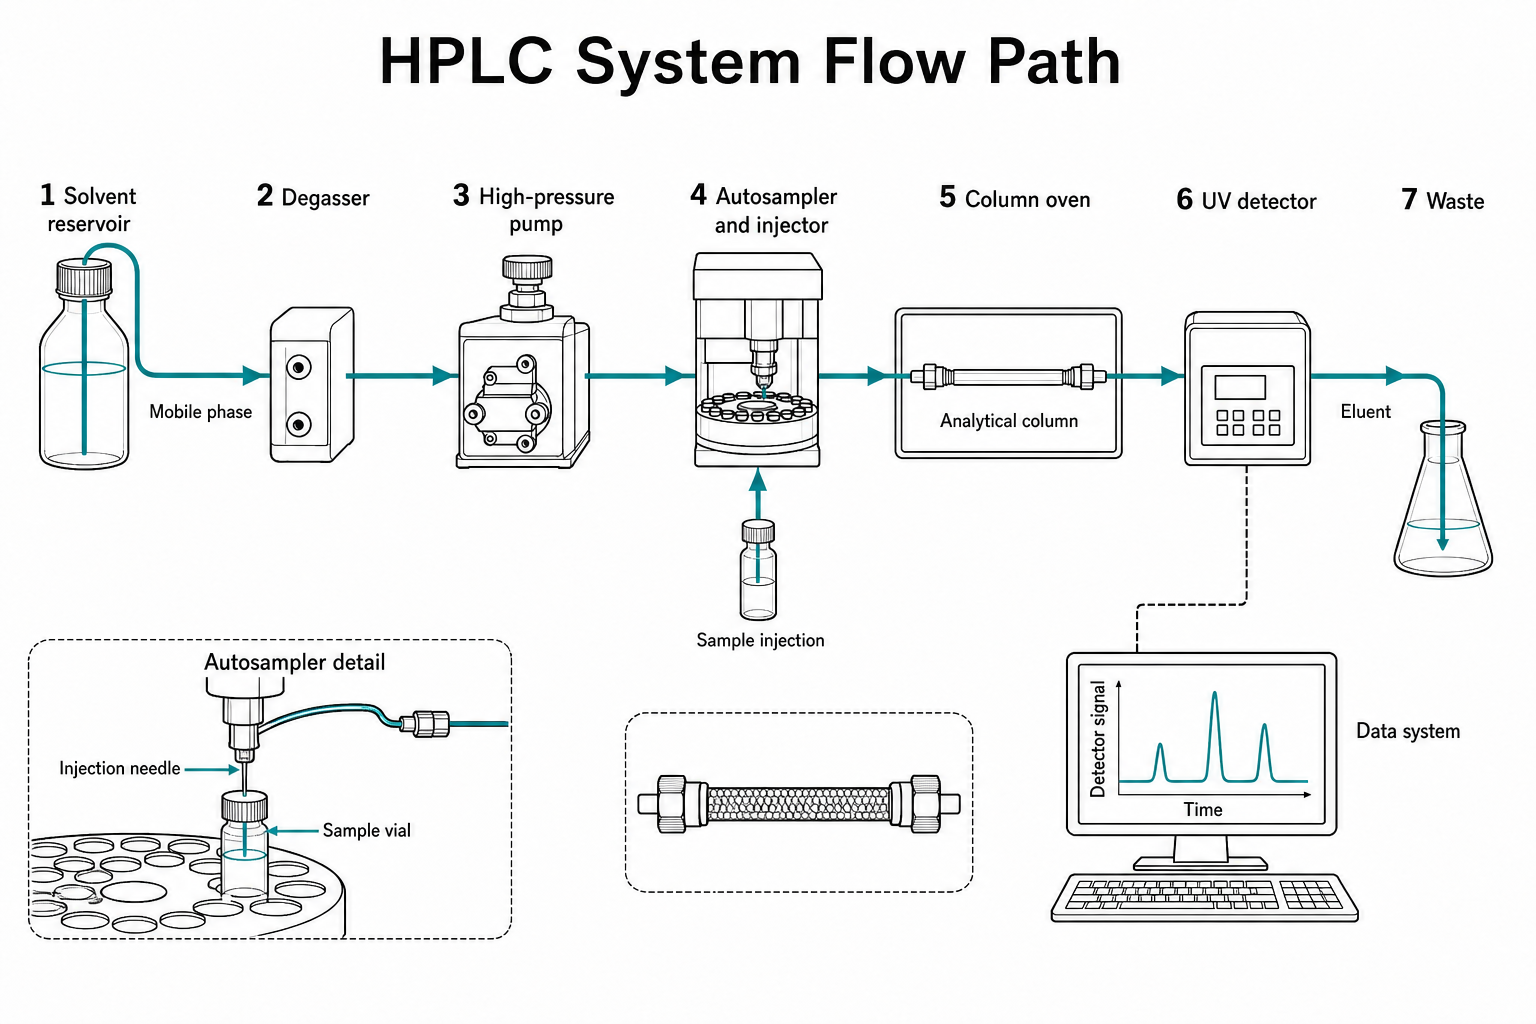
Choose line art, 3D rendering, or flat illustration based on what your reader needs to inspect—not on decoration. Each guide combines a preconfigured generator with examples, prompt structure, and a review checklist.
Compare the guidesStart with the communication task
Visual style should follow the scientific communication problem. A pathway with exact labels has different needs from a device cutaway or a graphical abstract, even when all three are generated from text.
These guides separate structural decisions from visual polish. Start with the required relationships, choose the simplest style that makes them legible, and then review the output against the source material and final publication context.
Guide index
Choose a focused starting point
Each guide opens a preconfigured generator and adds examples, prompt structure, limitations, and a scientific review checklist for that specific task.
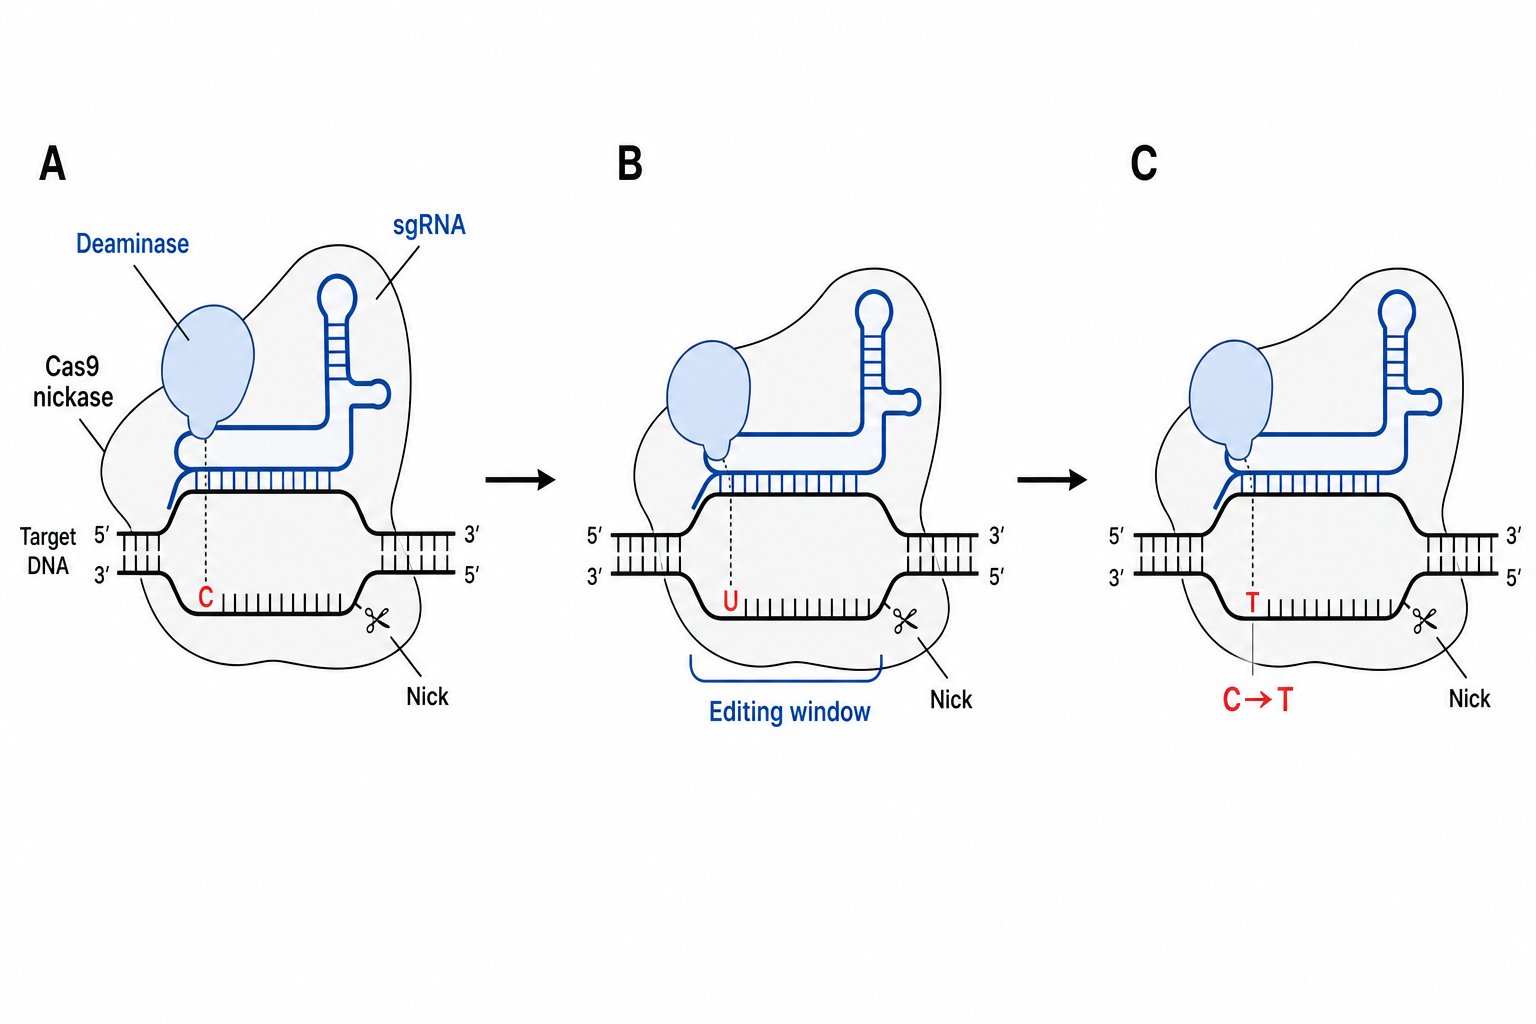
Scientific figure style · Line art
Scientific Line Art Generator
Create clean black-and-white scientific diagrams with precise outlines, labels, arrows, and process order for papers, methods, and technical documentation.
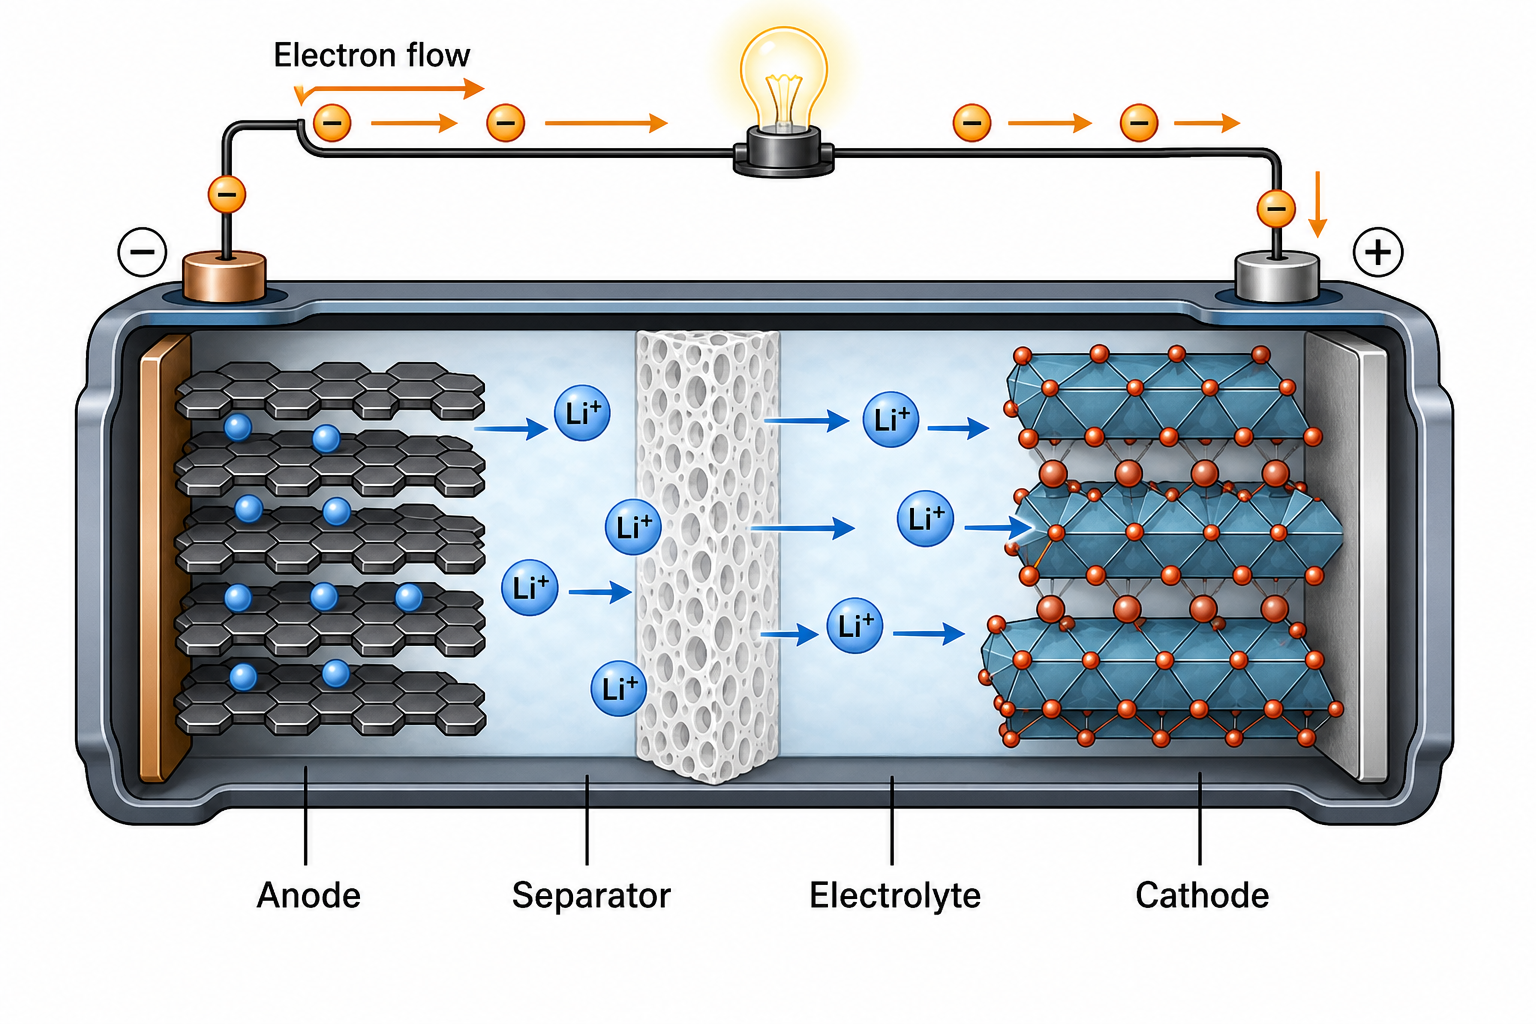
Scientific figure style · 3D render
3D Scientific Figure Generator
Generate polished 3D scientific illustrations for structures, devices, materials, presentations, and cover concepts while keeping spatial relationships clear.
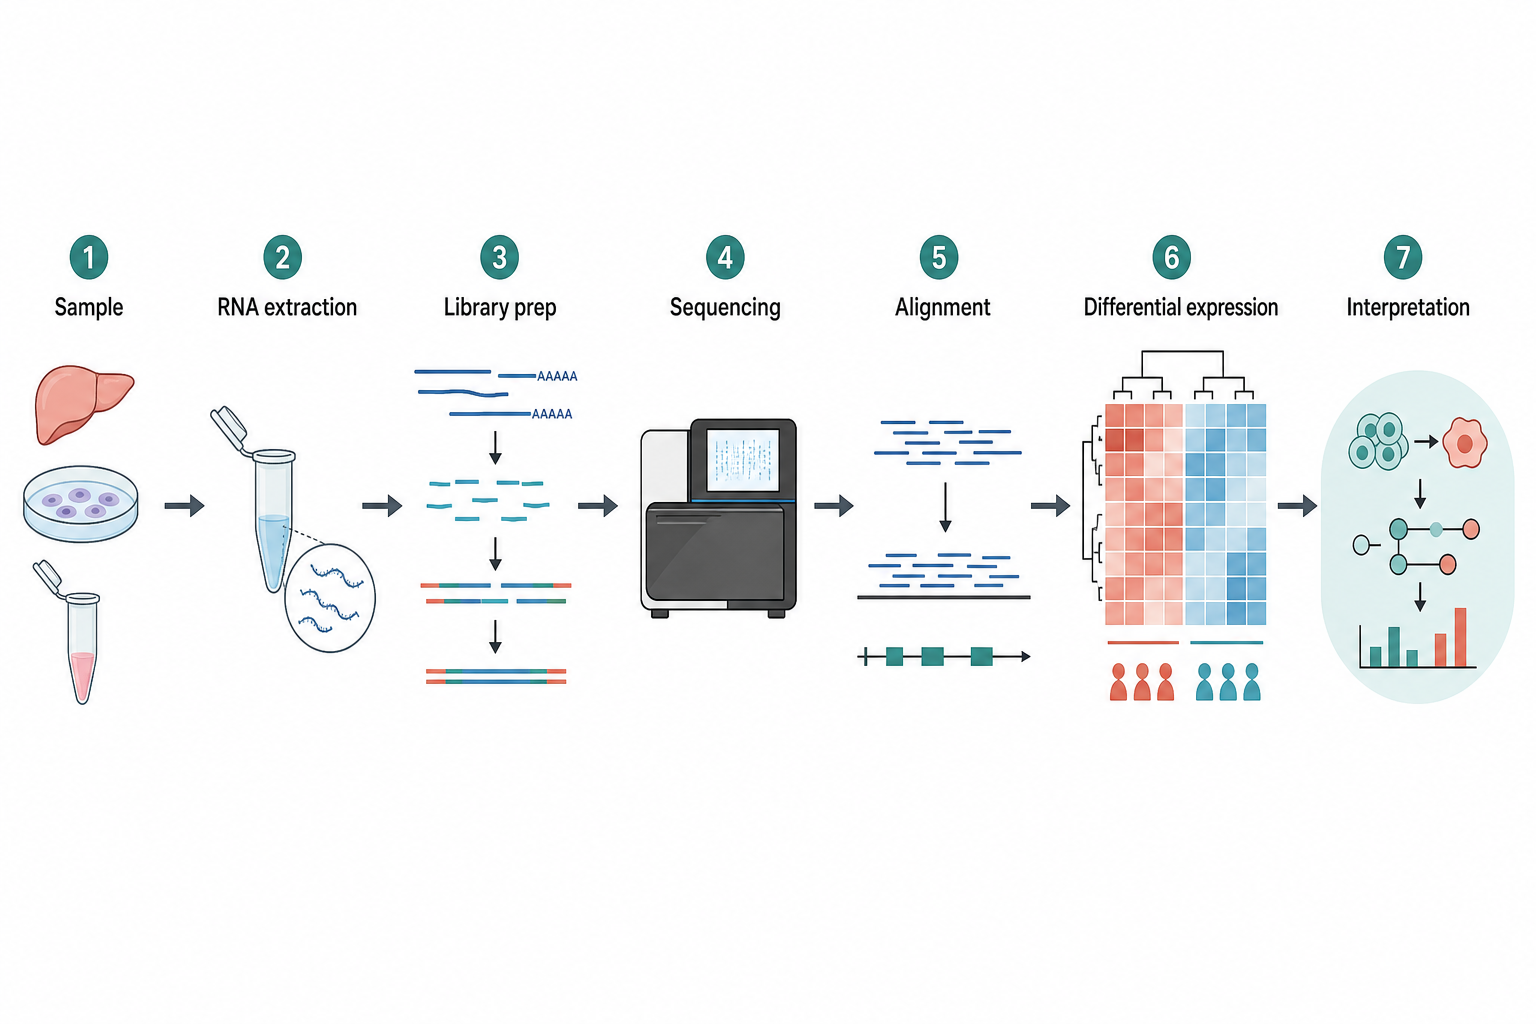
Scientific figure style · Flat illustration
Flat Scientific Illustration Generator
Create clear vector-style scientific illustrations with a restrained color system for graphical abstracts, workflows, teaching materials, and visual summaries.
Compare before generating
The right choice is the one that makes the scientific relationship easier to inspect—not the one with the most visual effects.
| Guide | Best for | Visual language | Review priority |
|---|---|---|---|
| Scientific Line Art Generator | Mechanisms, methods, apparatus | Precise strokes and labels | Arrows, terms, and topology |
| 3D Scientific Figure Generator | Structures, devices, materials | Depth, cutaways, spatial cues | Geometry and relative position |
| Flat Scientific Illustration Generator | Abstracts, workflows, teaching | Shapes, groups, restrained color | Hierarchy and color meaning |
Decision sequence
Plan the figure in four passes
- 01
Define the reading task
Write the one relationship, sequence, or structure the reader must understand before choosing a visual treatment.
- 02
Match the information
Use line art for labels and topology, 3D for spatial relationships, and flat illustration for grouped visual summaries.
- 03
Set publication constraints
Name the final size, aspect ratio, color limits, background, and whether the figure must work in grayscale.
- 04
Review the scientific claim
Check every label, arrow, structure, and implied relationship against your source before publishing.
Next step
Select a guide, adapt its prompt, then review the science
- 5 free signup figures
- Style-specific examples
- Researcher review required
Use-case guides start from the publication task rather than the visual treatment.