01
Minutes, Not Days
Describe your figure in plain words and get a polished scientific diagram in under a minute. No drawing, no software, no learning curve.

 5 free figures
 Turn your idea into a clean, publication-ready scientific figure in minutes — no design skills needed. Free for researchers.
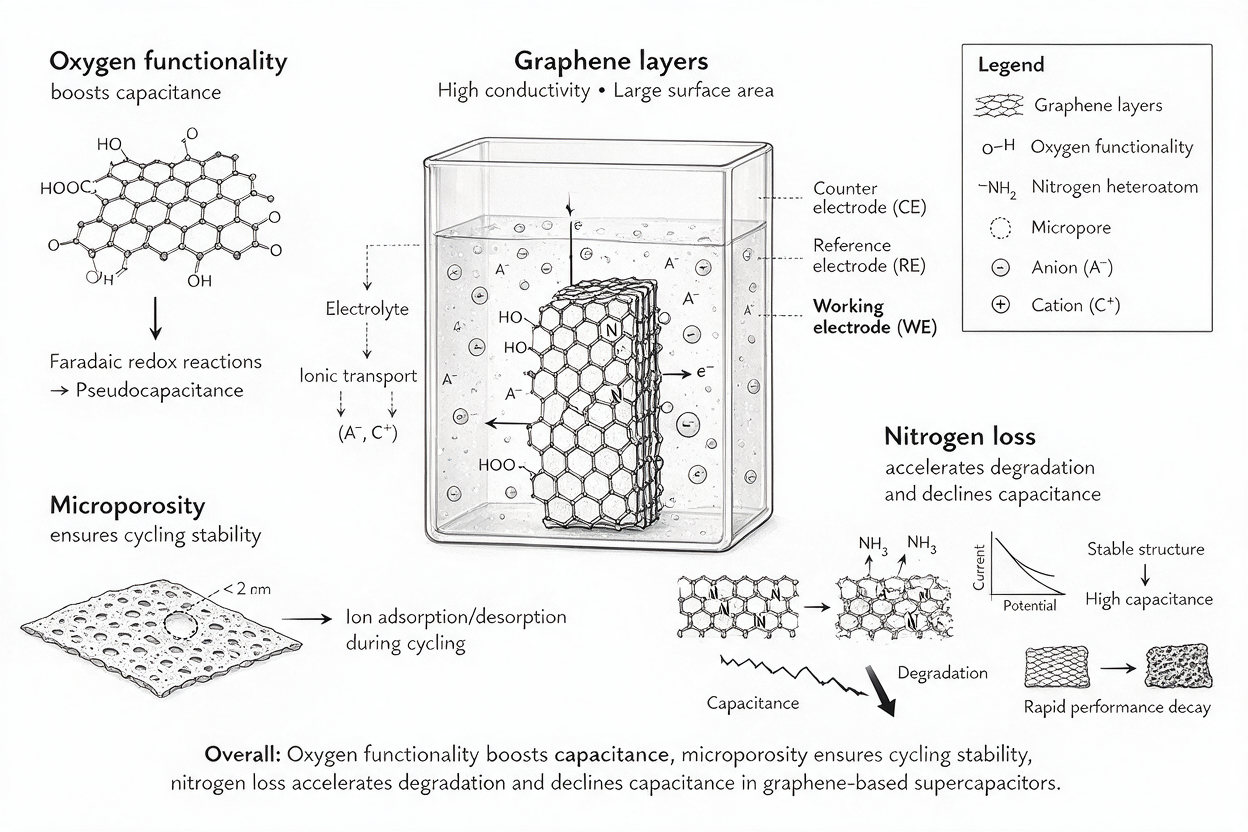
Trusted by researchers from leading institutions worldwide













Describe your figure in plain words and get a polished scientific diagram in under a minute. No drawing, no software, no learning curve.
Pick line art for journals, 3D render for presentations, or flat design for graphical abstracts — one tool covers all your figure needs.
Verify a new account for 5 free figures, then use the same balance for generation and editing with any model.
Type what you need: a mechanism diagram, a workflow, a pathway, or any scientific concept.
Choose line art, 3D, or flat design. Adjust to match your paper or presentation.
Mark any area that needs work and describe the change. When the figure is right, save it and choose the export you need.
Figure formats
Start with the communication job, not the visual effect. The same research description can become a mechanism, pathway, workflow, or graphical abstract, but each format needs a different reading order and level of detail. Choose the type that matches what a reader must understand, then describe the required relationships before selecting a visual style.
Use a mechanism diagram when the reader needs to follow a causal sequence rather than inspect a list of isolated components. Describe the starting condition, each required intermediate, the direction of activation or inhibition, and the final biological or physical outcome. Name the compartments, molecules, materials, or devices that must appear. A precise description gives the scientific figure maker enough structure to create a readable left-to-right or top-to-bottom explanation without inventing unsupported steps.
Pathway figures organize connected reactions, signaling events, or transport processes into a visual hierarchy. State which nodes are central, which branches are secondary, and whether arrows mean activation, conversion, movement, or inhibition. Include the exact labels used in your manuscript so the image and text remain consistent. For dense pathways, request grouped modules and a restrained color system instead of asking the model to place every possible interaction on one crowded canvas.
An experimental workflow should map the real order of samples, instruments, transformations, quality checks, and outputs. List the steps in sequence and include only parameters that matter for interpretation, such as incubation time, temperature, flow direction, measurement unit, or analysis stage. Ask for numbered steps when the process is procedural, and specify where a branch or decision occurs. This creates a figure that can support a methods overview without pretending to replace the full protocol.
A graphical abstract compresses the study into one visual reading path: research context, decisive method or mechanism, and primary supported outcome. Identify the one conclusion the reader should understand first, then remove secondary experiments that compete with it. Flat illustration usually works well here because it can combine samples, processes, and outcomes with consistent shapes. Keep claims aligned with the paper and avoid decorative charts or numbers that were not measured in the study.
— describe any scientific concept and get a diagram instantly
— line art, 3D render, and flat design
— high-resolution exports for journals and posters
— consistent style across your manuscript and presentation
— 10 credits at 1K and 20 credits at 2K
— biology, chemistry, physics, engineering, and more
Style selection
Publication context changes what “professional” means. A manuscript figure must remain precise at small size, while a presentation can use depth and stronger visual separation. Pick the style that protects the scientific message in its final setting rather than choosing the most decorative option.
Choose line art when labels, arrow direction, apparatus geometry, molecular relationships, or grayscale reproduction matter more than depth. It is a strong default for mechanisms, pathways, experimental setups, and methods figures. Ask for a white background, consistent line weights, exact component names, restrained accent colors, and enough spacing for single-column publication size. Before submission, check every label and connection against the manuscript because a clean drawing can still communicate the wrong relationship if the prompt is vague.
Use a 3D render when spatial organization is the scientific point: layered materials, device architecture, internal components, tissue geometry, or a cutaway view. Specify the viewpoint, which surfaces should be transparent or separated, and where scale cues are needed. Presentations and covers can support more depth and lighting than a small journal panel, but visual polish should not hide the mechanism. Keep labels outside busy regions and avoid perspective that makes dimensions or connections look physically impossible.
Flat design is useful for graphical abstracts, posters, and overview slides that must be understood quickly at a distance. Use a limited palette to distinguish inputs, processes, and outcomes, and keep one consistent visual grammar across icons and arrows. Describe the intended reading order and final aspect ratio before generating. For poster use, shorten labels and increase contrast; for a journal contents image, simplify the story further so the main message survives at thumbnail size.
Before downloading, preview the figure at the size and aspect ratio used by the manuscript, slide, or poster. Confirm that labels remain readable, arrows still point to the intended targets, and colors preserve their meaning in grayscale or for readers with color-vision deficiencies. Check every molecular name, structure, unit, parameter, and causal relationship against your source material. If one detail is wrong, revise that requirement explicitly instead of adding more decoration. The scientific figure maker can accelerate drafting, but the researcher remains responsible for deciding whether the final image accurately represents the study.
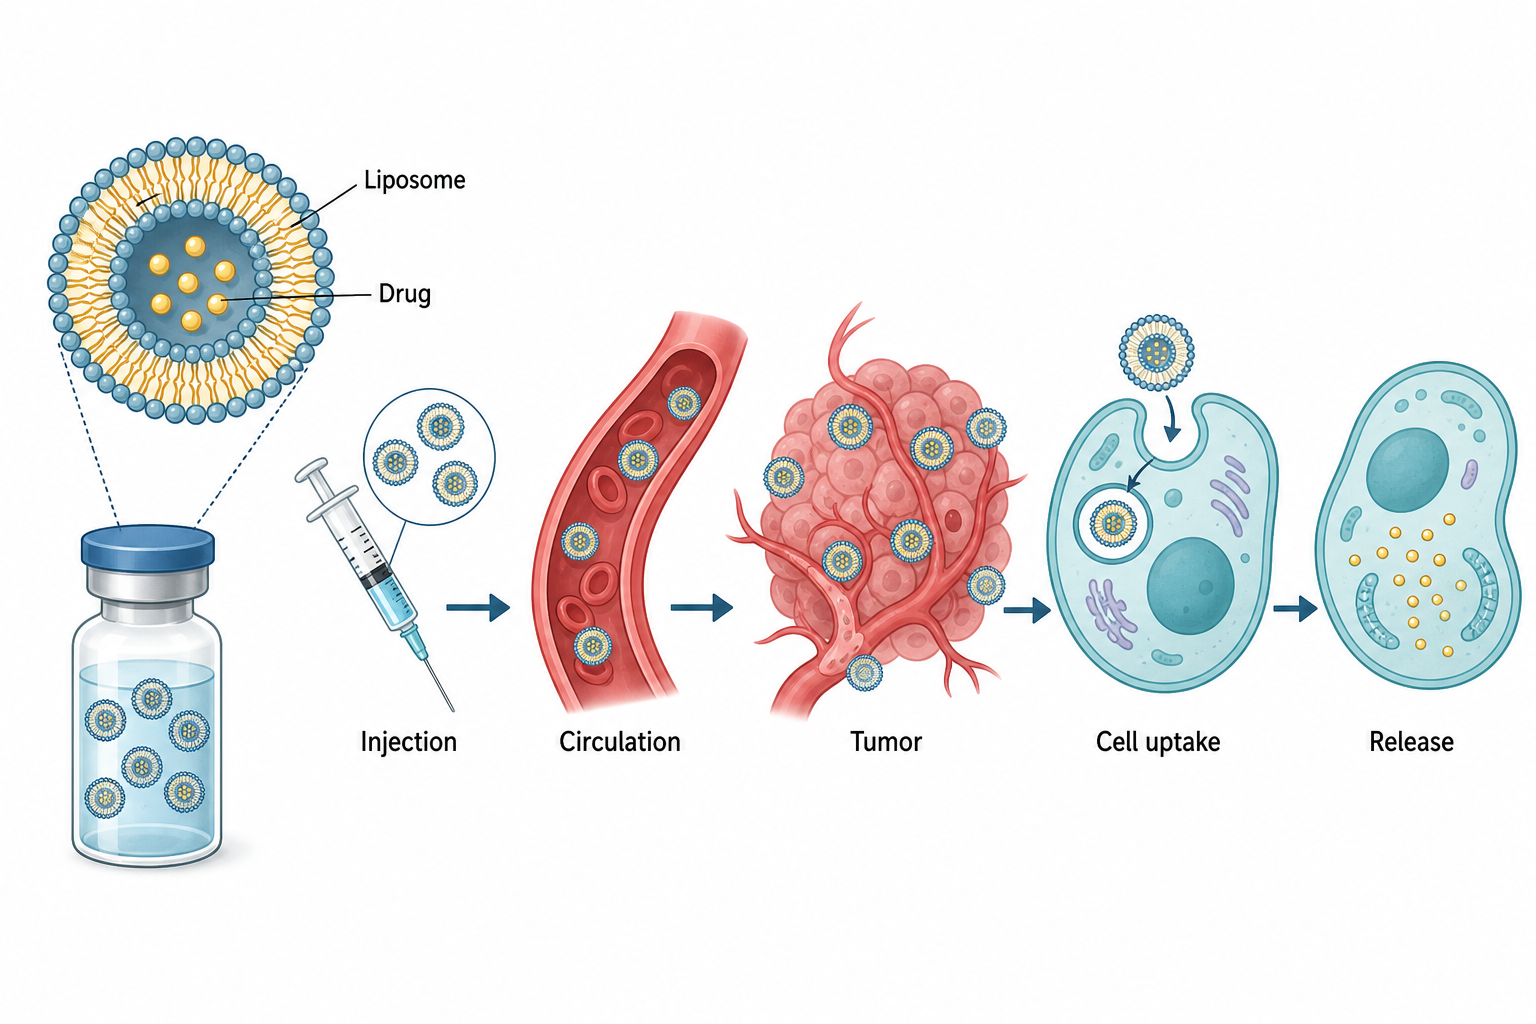
Liposome suspension formulation
Plain-text description
"Generate the best diagrammatic image prompt for novel drug delivery system of liposome suspension formulation"
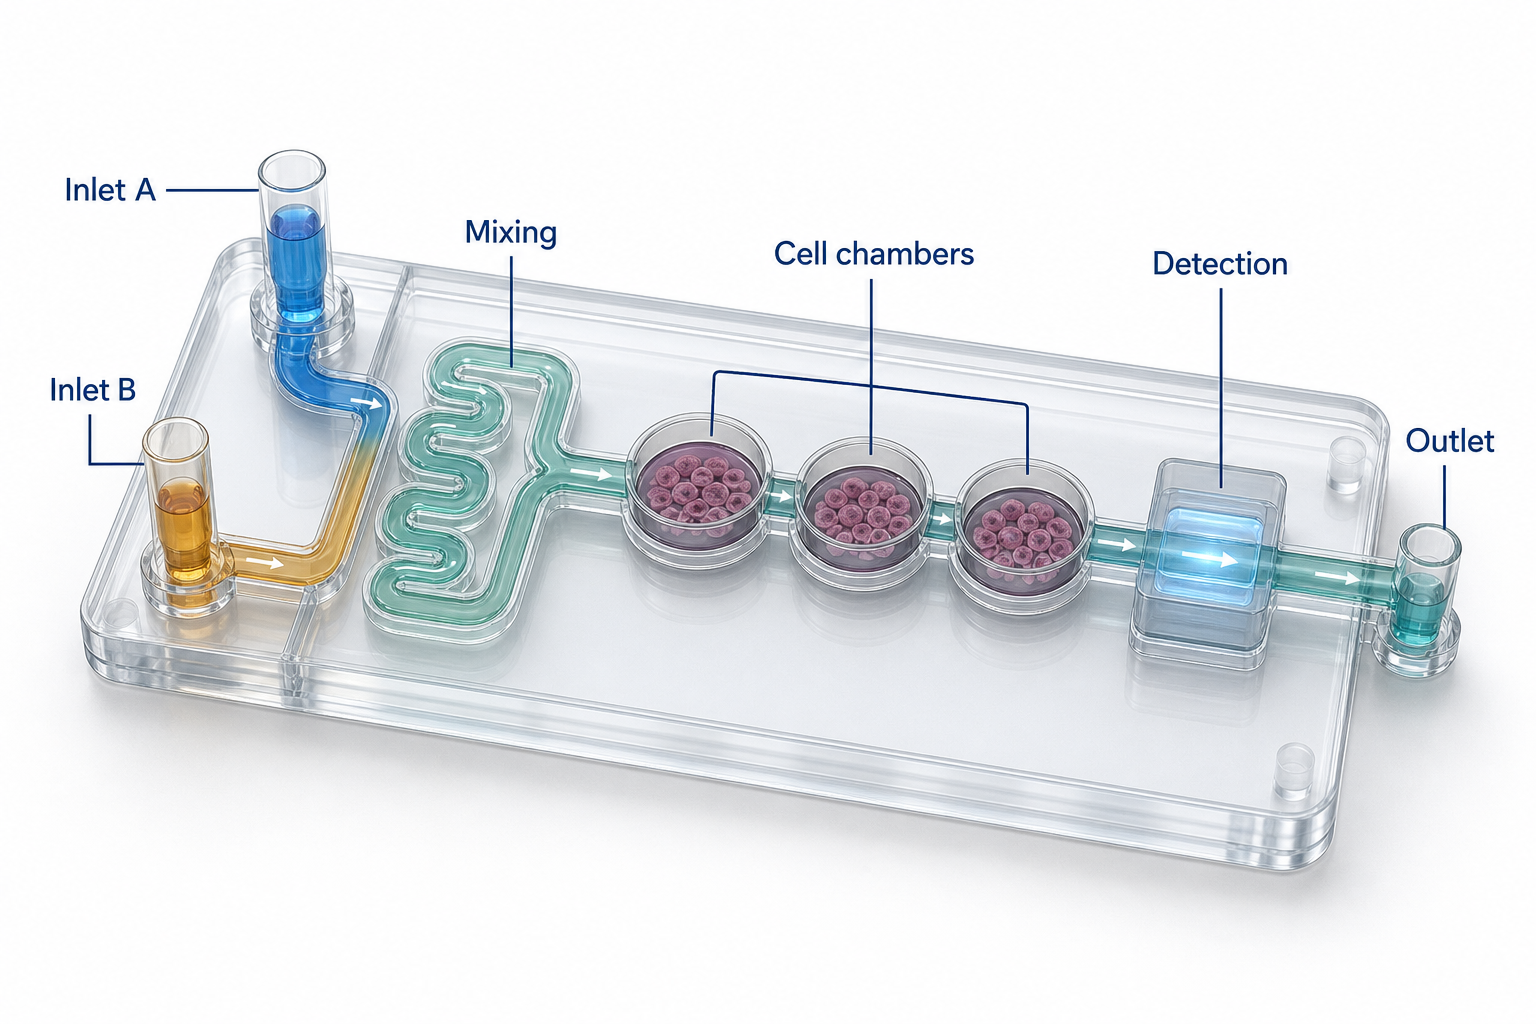
Microfluidic organ-on-chip
Plain-text description
"Create a 3D scientific render of a microfluidic organ-on-chip workflow"
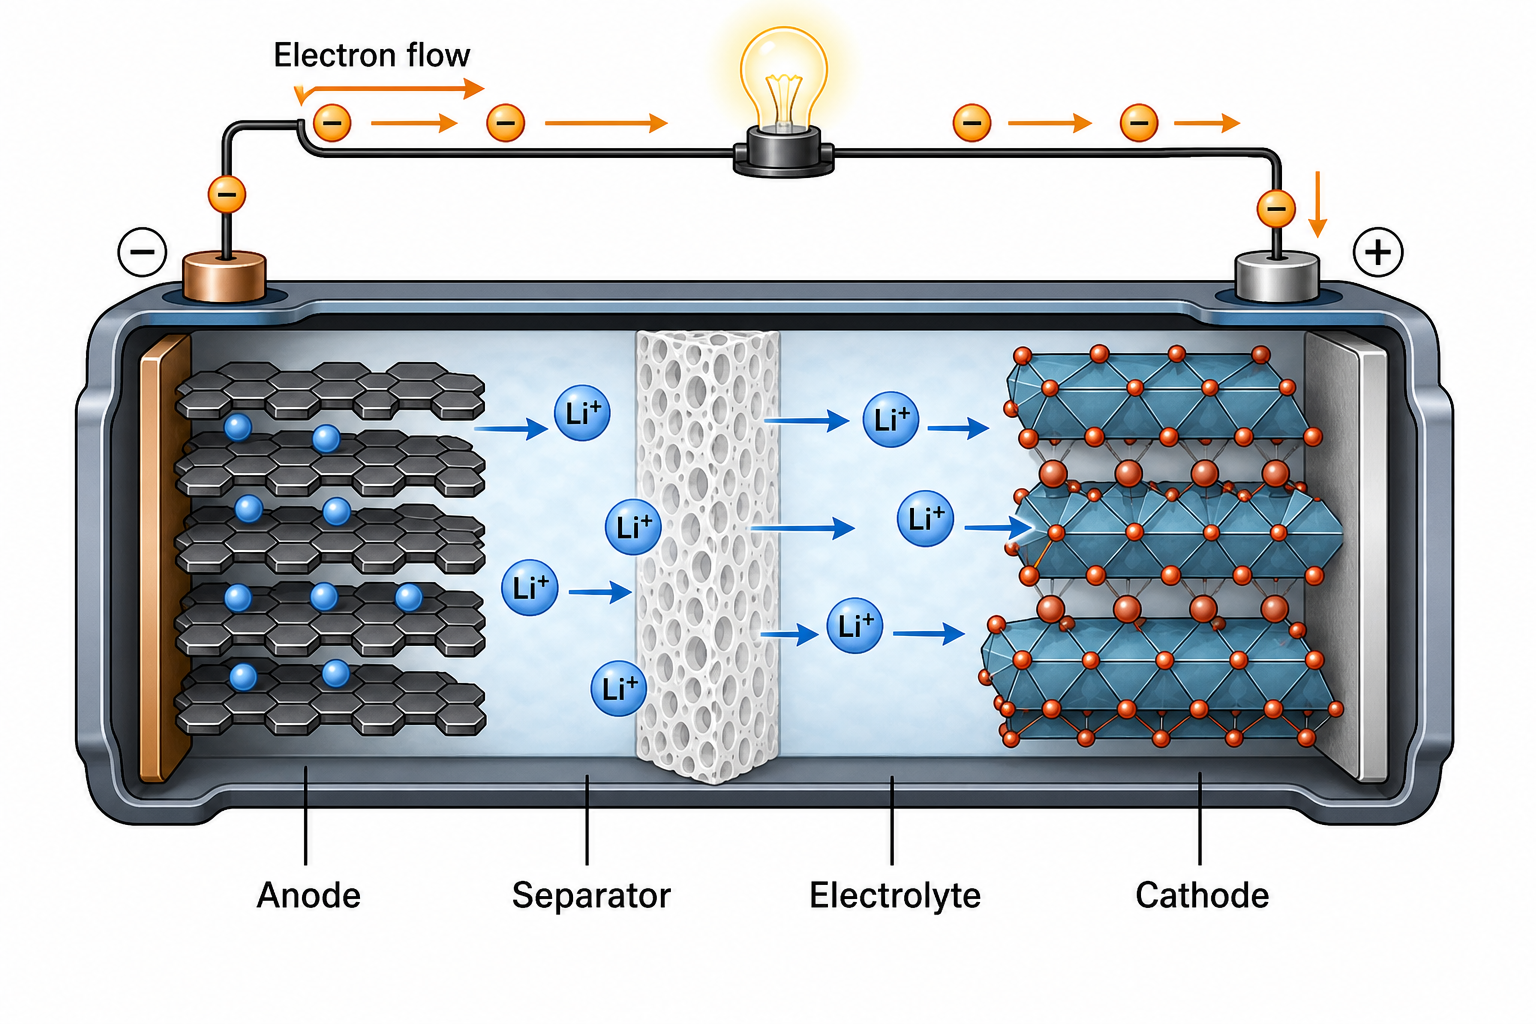
Lithium-ion battery discharge
Plain-text description
"Create a publication-quality cutaway diagram of a rechargeable lithium-ion battery during discharge"
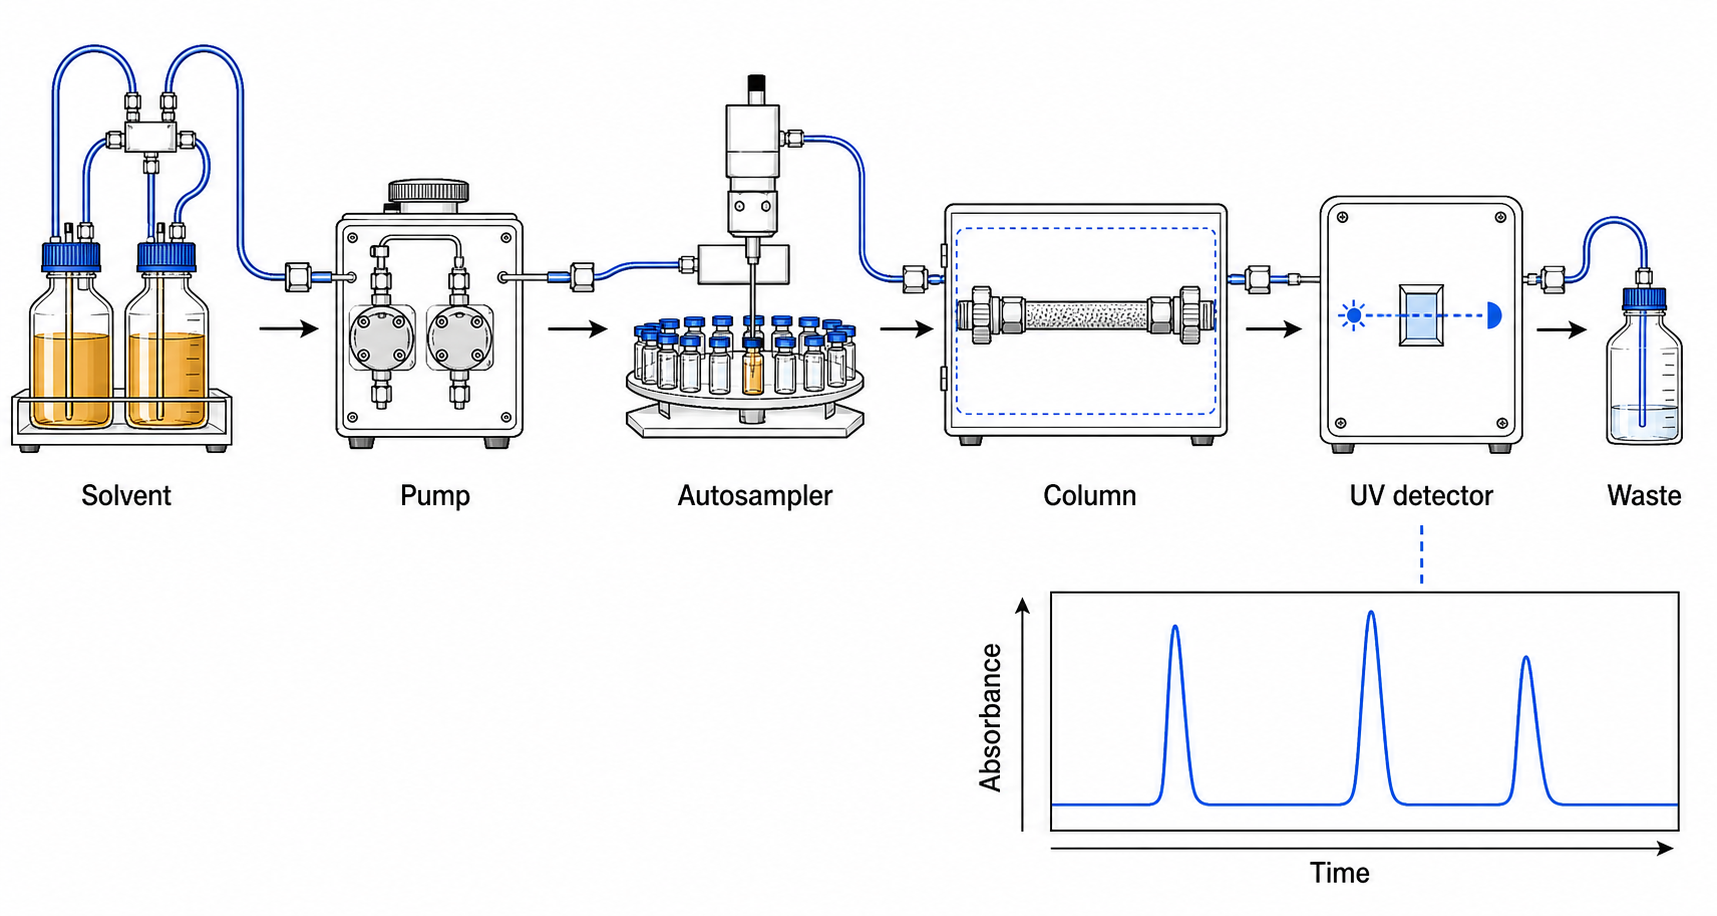
HPLC instrument flow path
Plain-text description
"Create a labeled HPLC instrument flow path with a representative chromatogram"
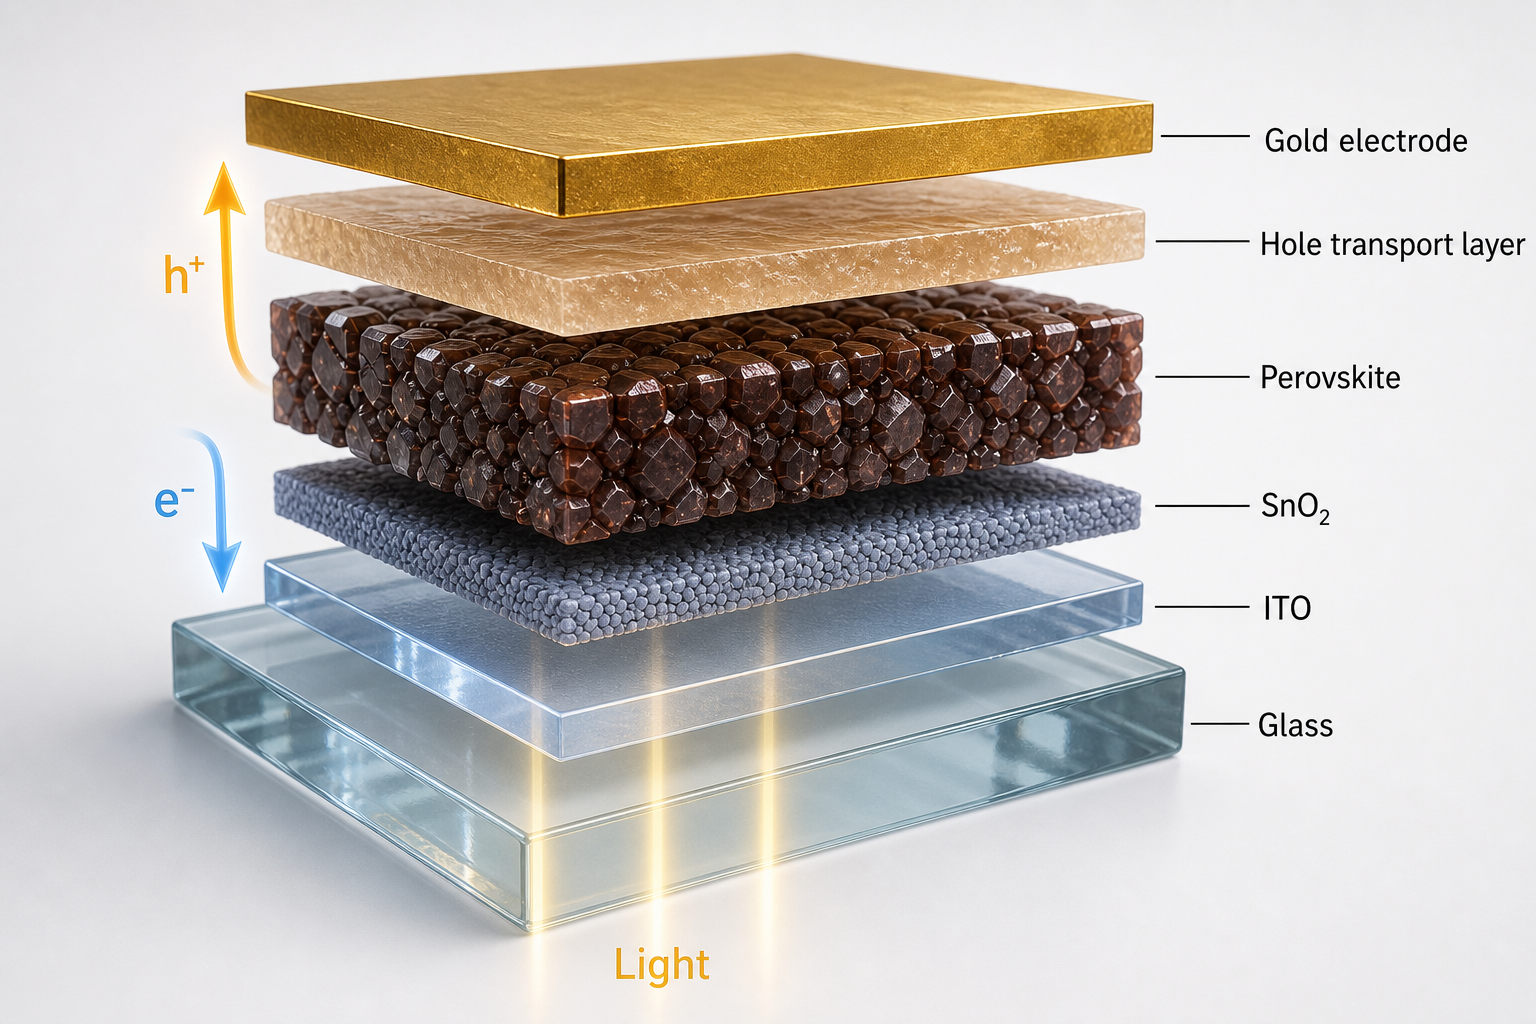
Perovskite solar cell
Plain-text description
"Create a 3D exploded figure of a perovskite solar cell layer stack"
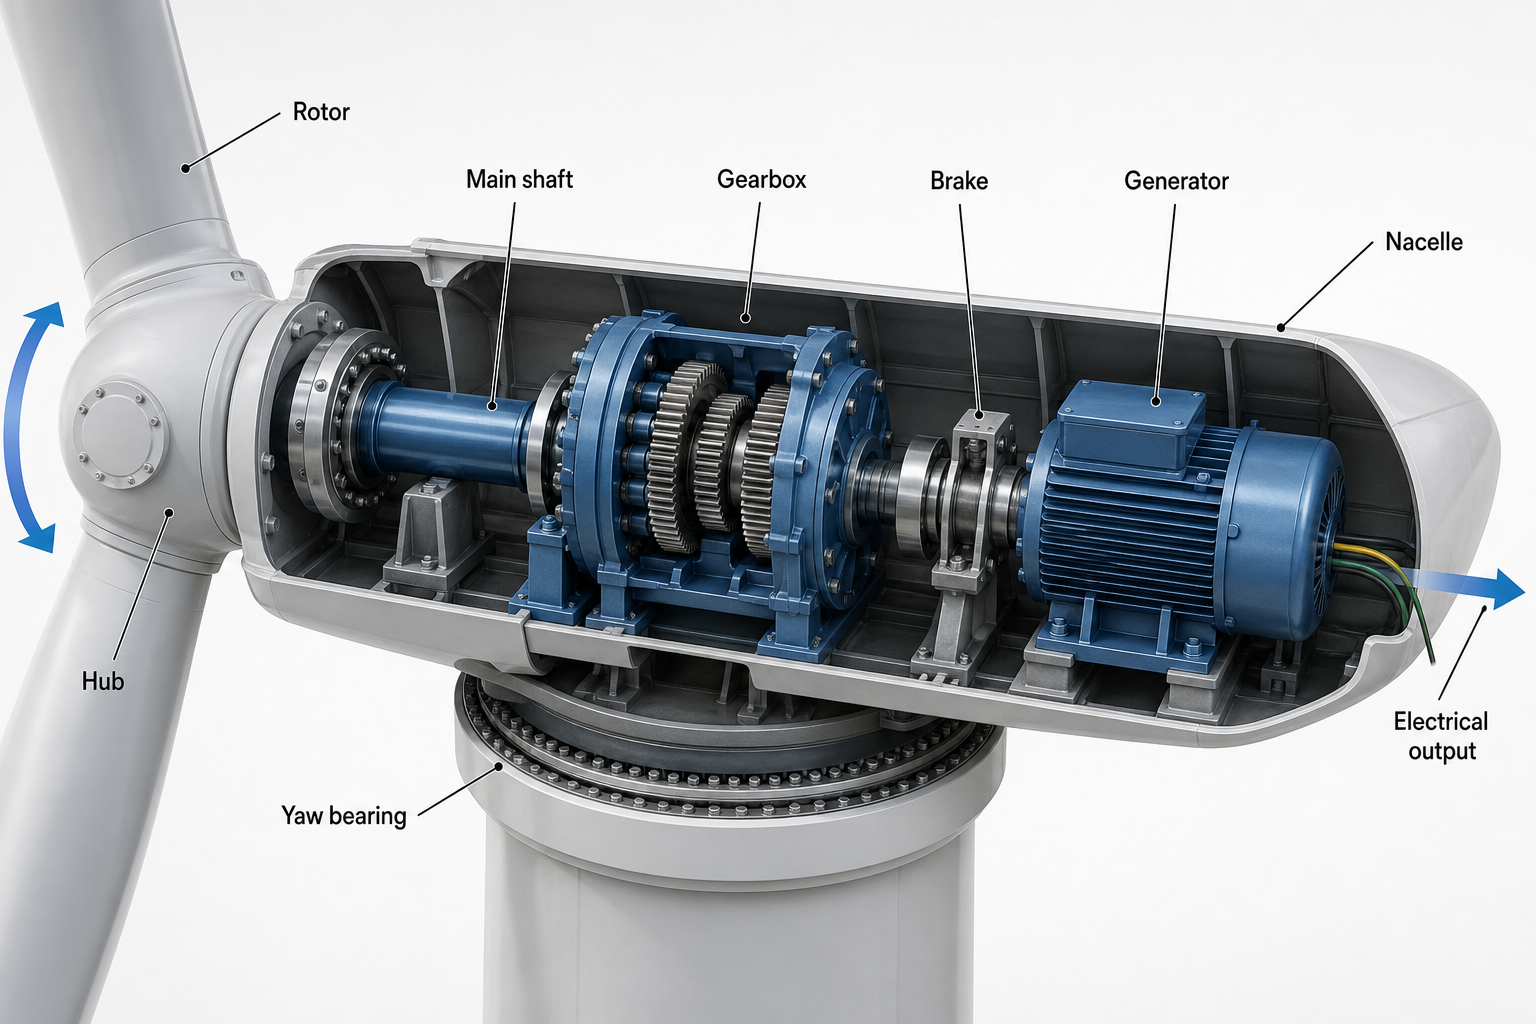
Wind turbine drivetrain
Plain-text description
"Create a 3D cutaway of a wind turbine nacelle and drivetrain"
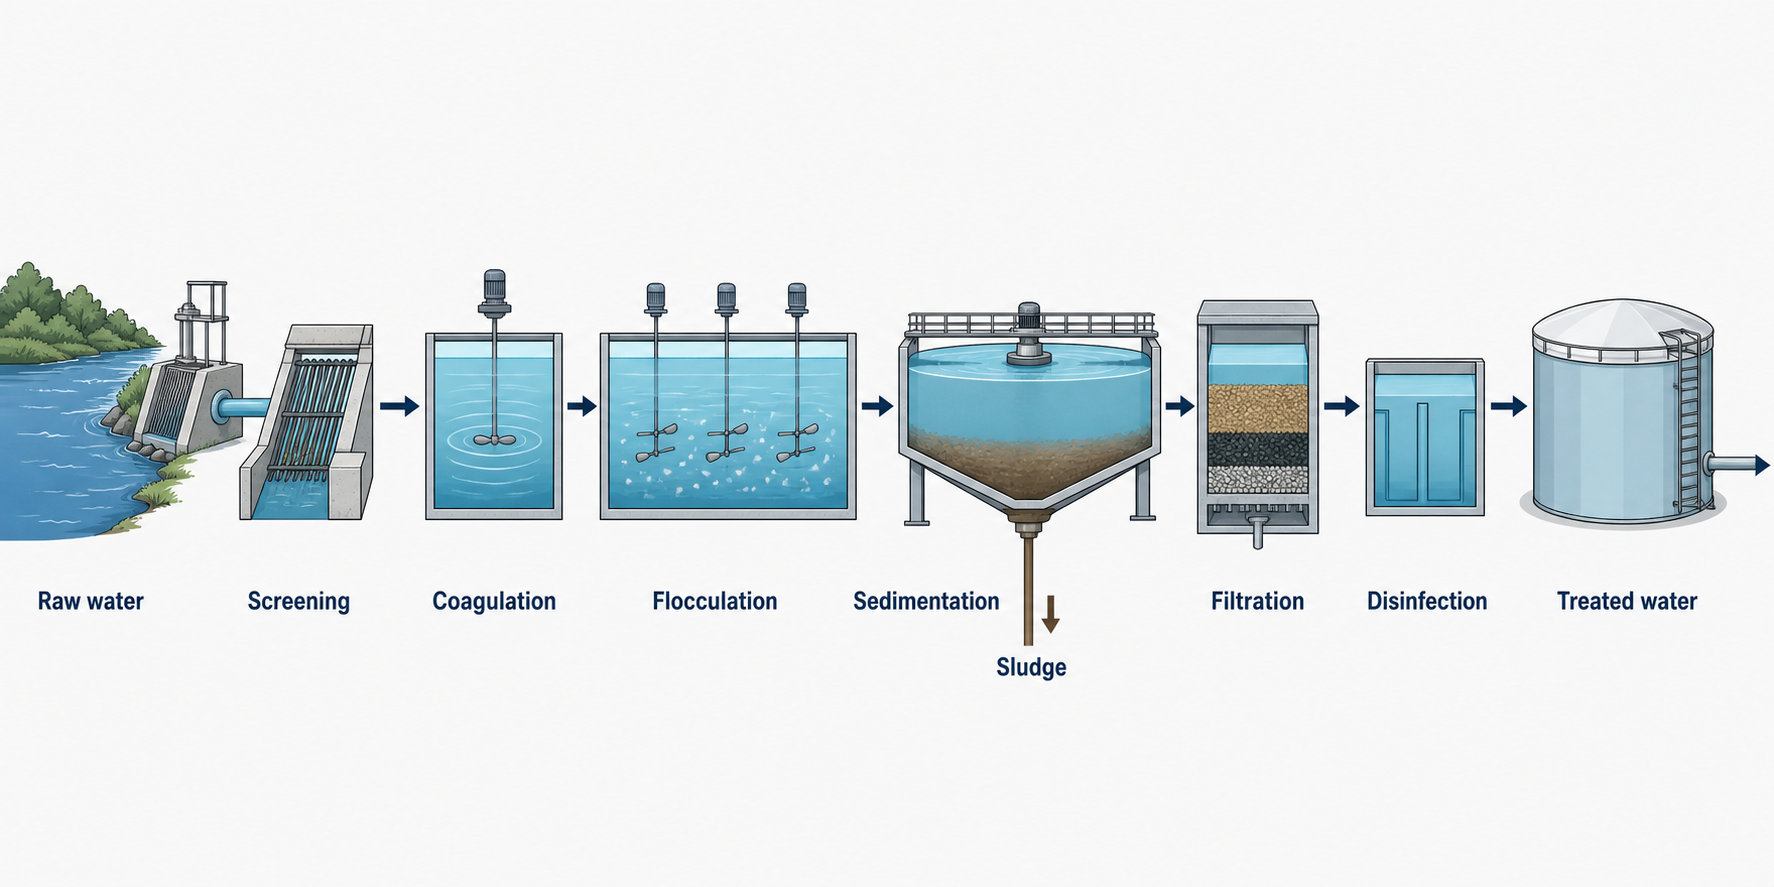
Water treatment train
Plain-text description
"Create a flat scientific workflow of a drinking-water treatment train"
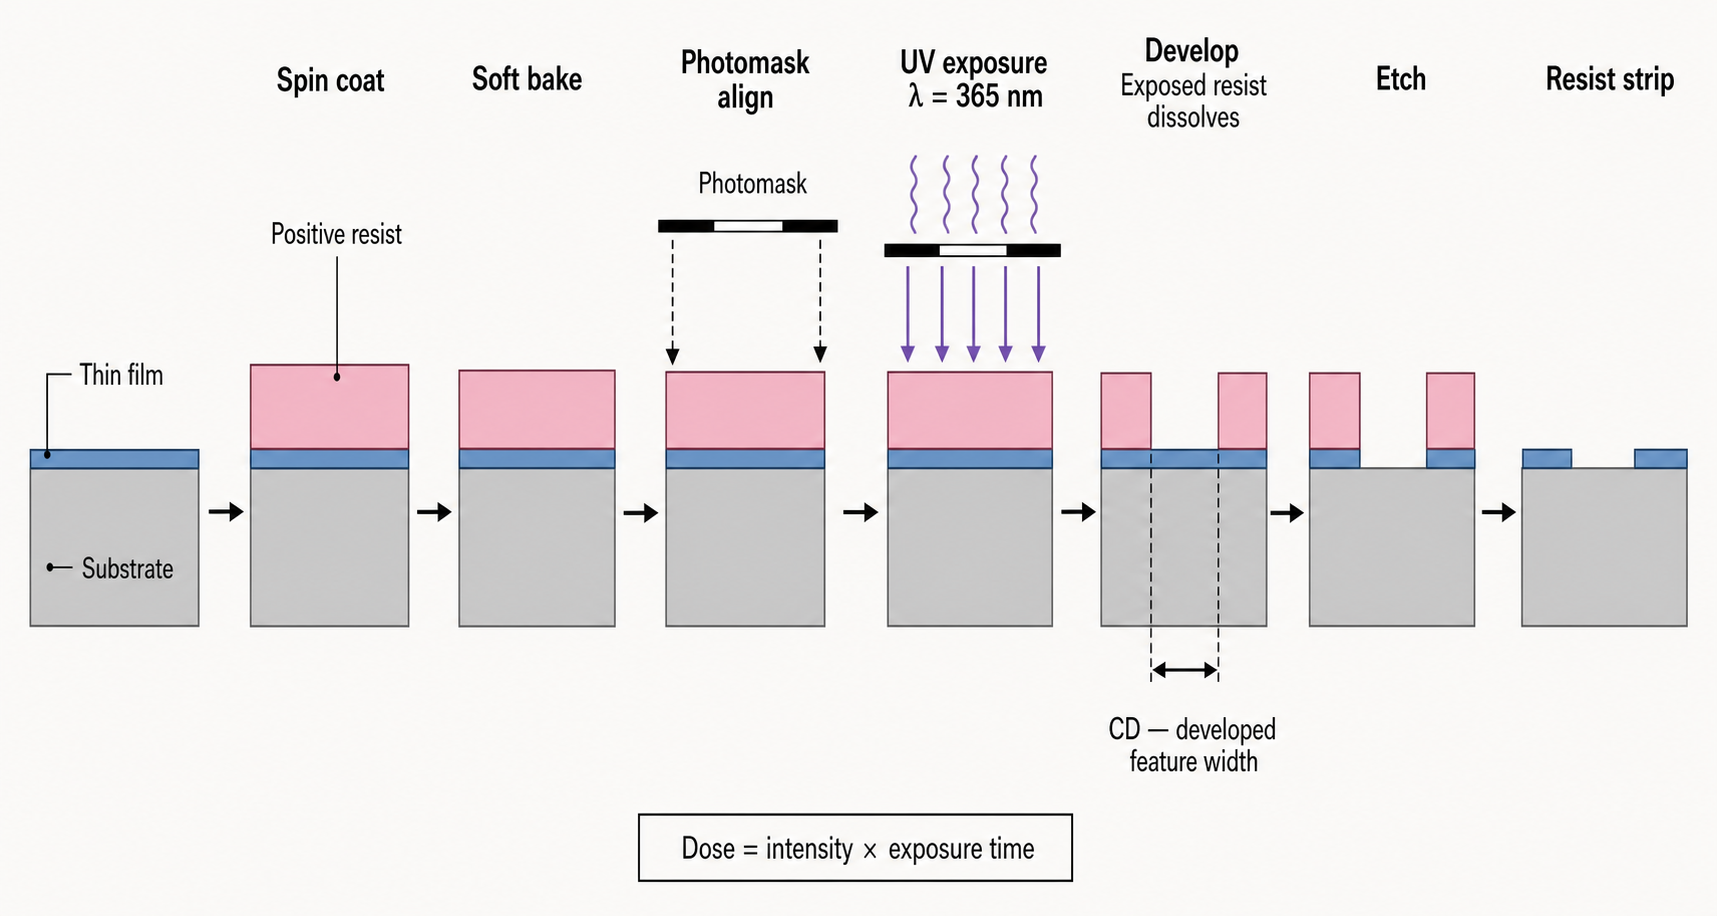
Positive-resist photolithography
Plain-text description
"Create a publication-style process figure for positive-resist photolithography"
Every example above was generated from a plain-text description. Type yours and get the same result.
— main figures, schematics, and supplementary diagrams
— one-glance visuals that summarize your study
— bold, readable figures that present well on screen and print
— consistent, publication-quality figures across your whole thesis
FAQ
It's an AI-powered tool that turns a plain-text description of your research into a clean, publication-ready scientific figure — no drawing or design skills required.
Yes — maker and generator both describe the same thing: an AI tool that creates scientific figures from your description. Different people search for it using different words.
New verified accounts receive 5 free figures: 3 at signup, 2 more the next day. Each successful 1K generation or edit uses 10 credits, and each successful 2K result uses 20 credits. Downloads are included.
Three styles are available: line art (great for journals), 3D render (great for presentations), and flat design (great for graphical abstracts).
Research papers, graphical abstracts, posters, conference slides, theses, and grant proposals. Figures are generated at publication quality.
No. Just describe what you need in plain text and pick a style — the AI handles the layout, labels, and styling for you.
Every successful 1K or 2K result in your account includes a PNG download without a separate unlock charge. The current editor does not export editable SVG.
Generation time depends on the selected model. Describe your concept, choose a style, review the preview, and refine any region that needs work before export.