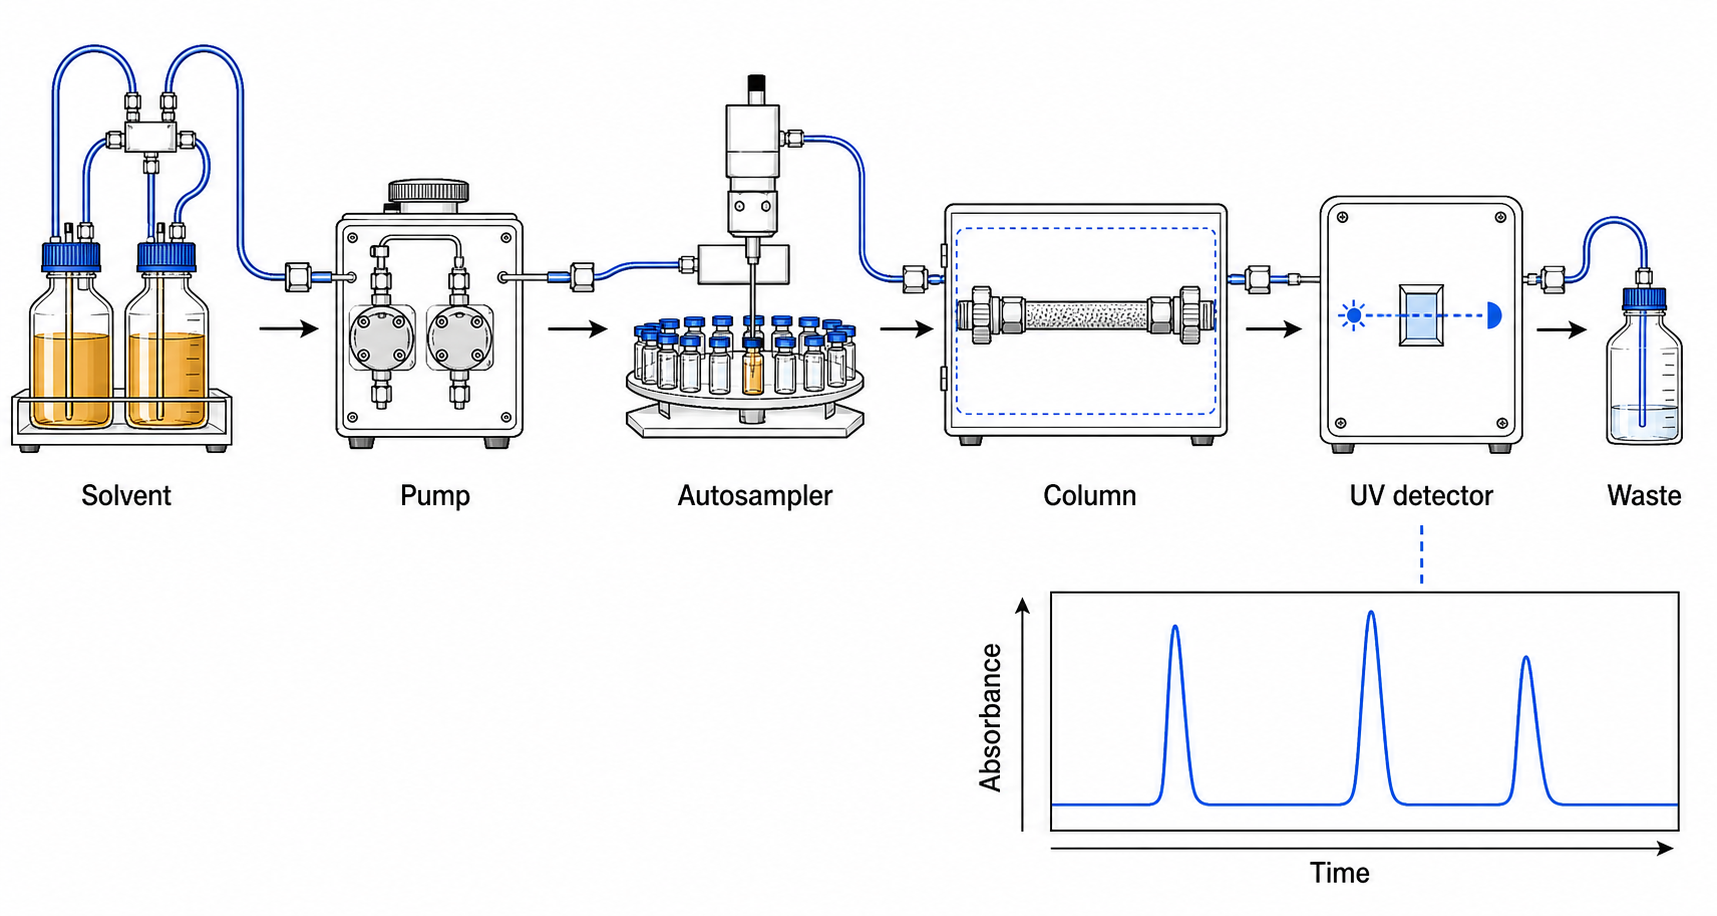
 01
01Instrument figure
An instrument panel should map directly to the components, connections, and outputs used in the method.

 5 free figures
 Scientific figure use case · Manuscripts
Draft mechanisms, methods, workflows, and structural overviews for manuscripts, then review every generated element against your evidence and journal requirements.
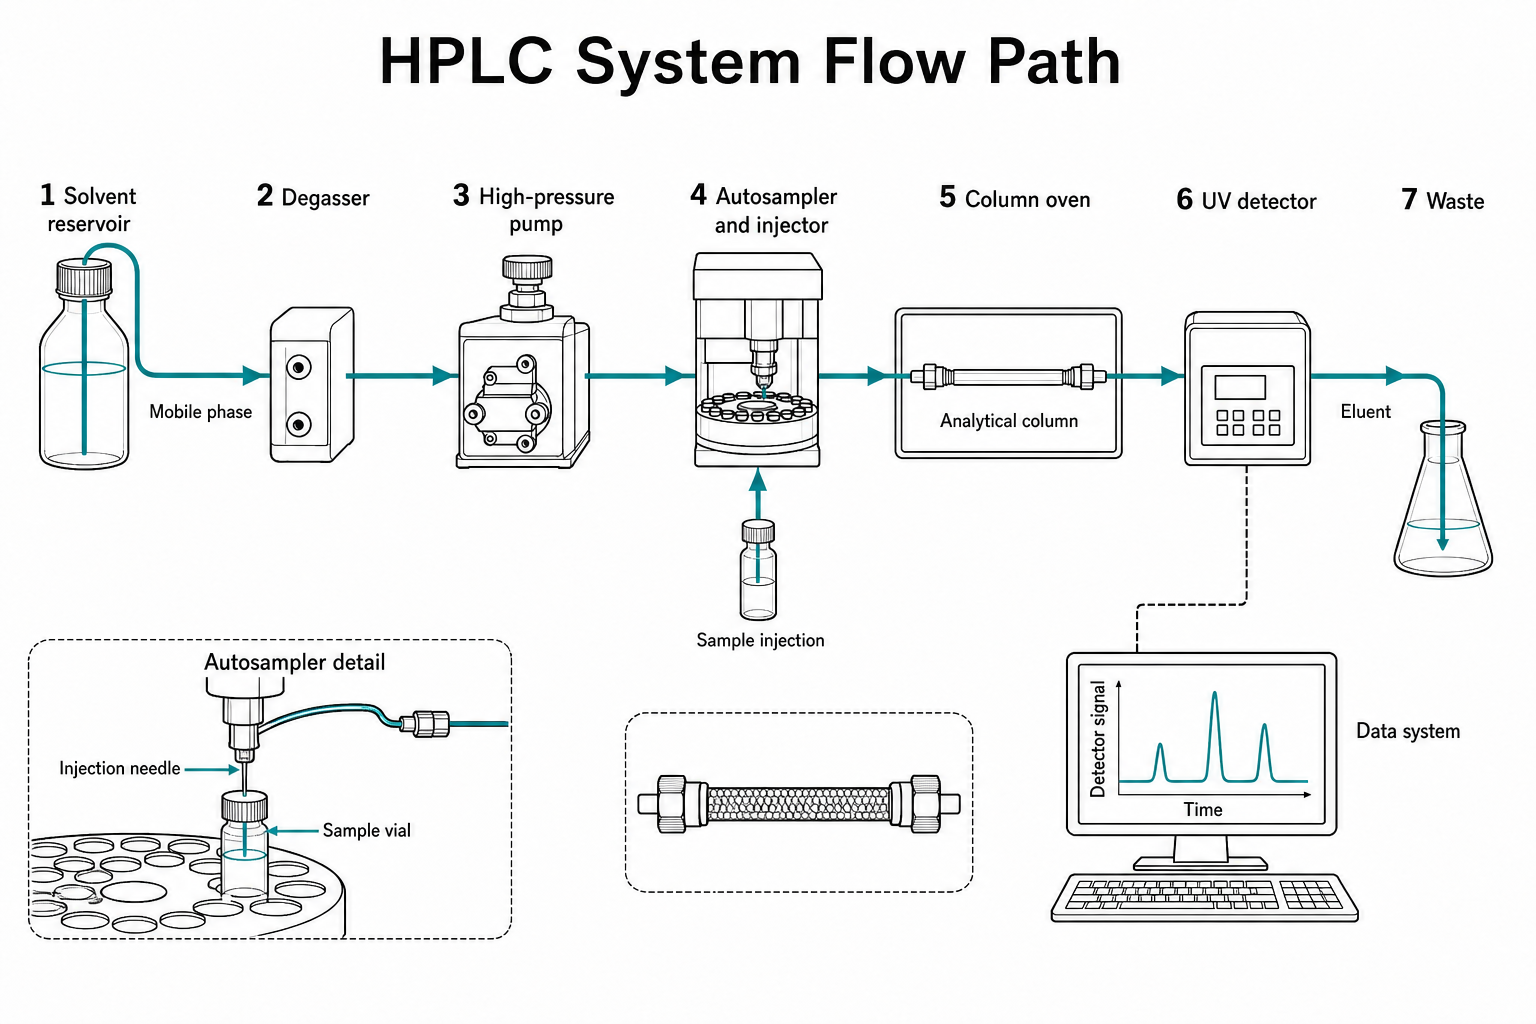
Field note 01
A figure for a research paper must do more than look scientific. It needs to support a specific statement in the manuscript, use terminology consistently, and remain legible at the dimensions set by the target journal. Generation can accelerate the first visual draft, but it does not replace source checking.
Start from the role of the figure: explaining a mechanism, documenting a method, showing a workflow, or providing structural context. Include only the elements required for that role. After generation, compare each label, arrow, scale, molecular structure, and visual claim with the underlying evidence.
Reference plates
Use these examples to decide what must be visible before you write the prompt. The subject changes, but the information hierarchy should remain deliberate.
01An instrument panel should map directly to the components, connections, and outputs used in the method.
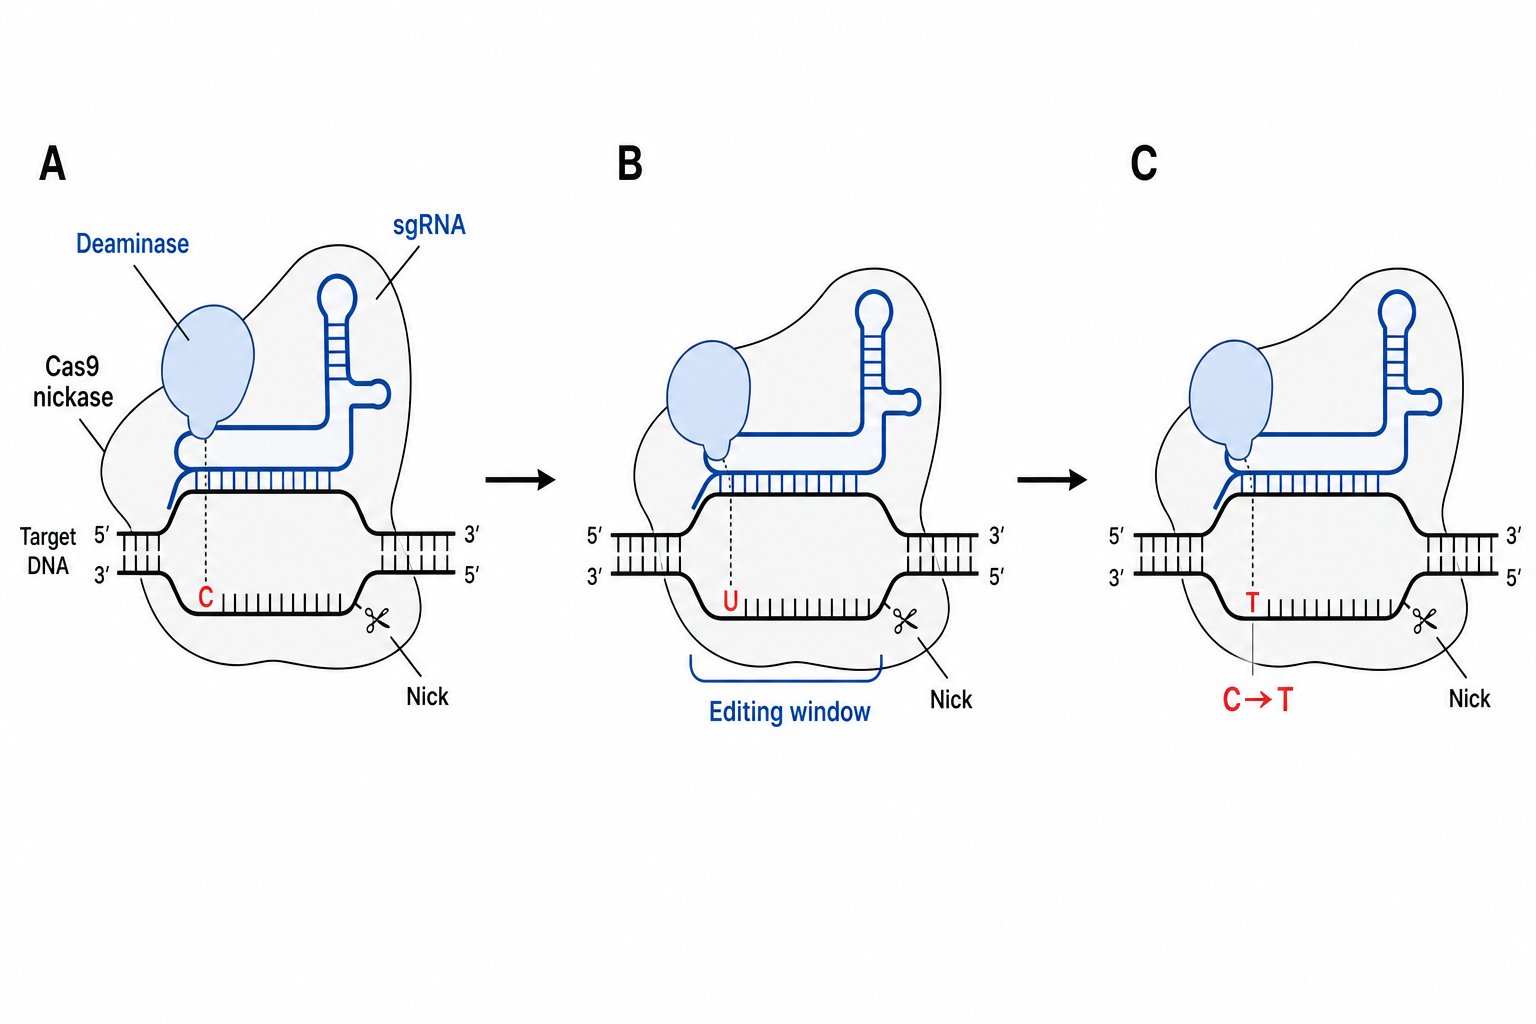 02
02Method figures need exact component names and should not imply steps that were not performed.
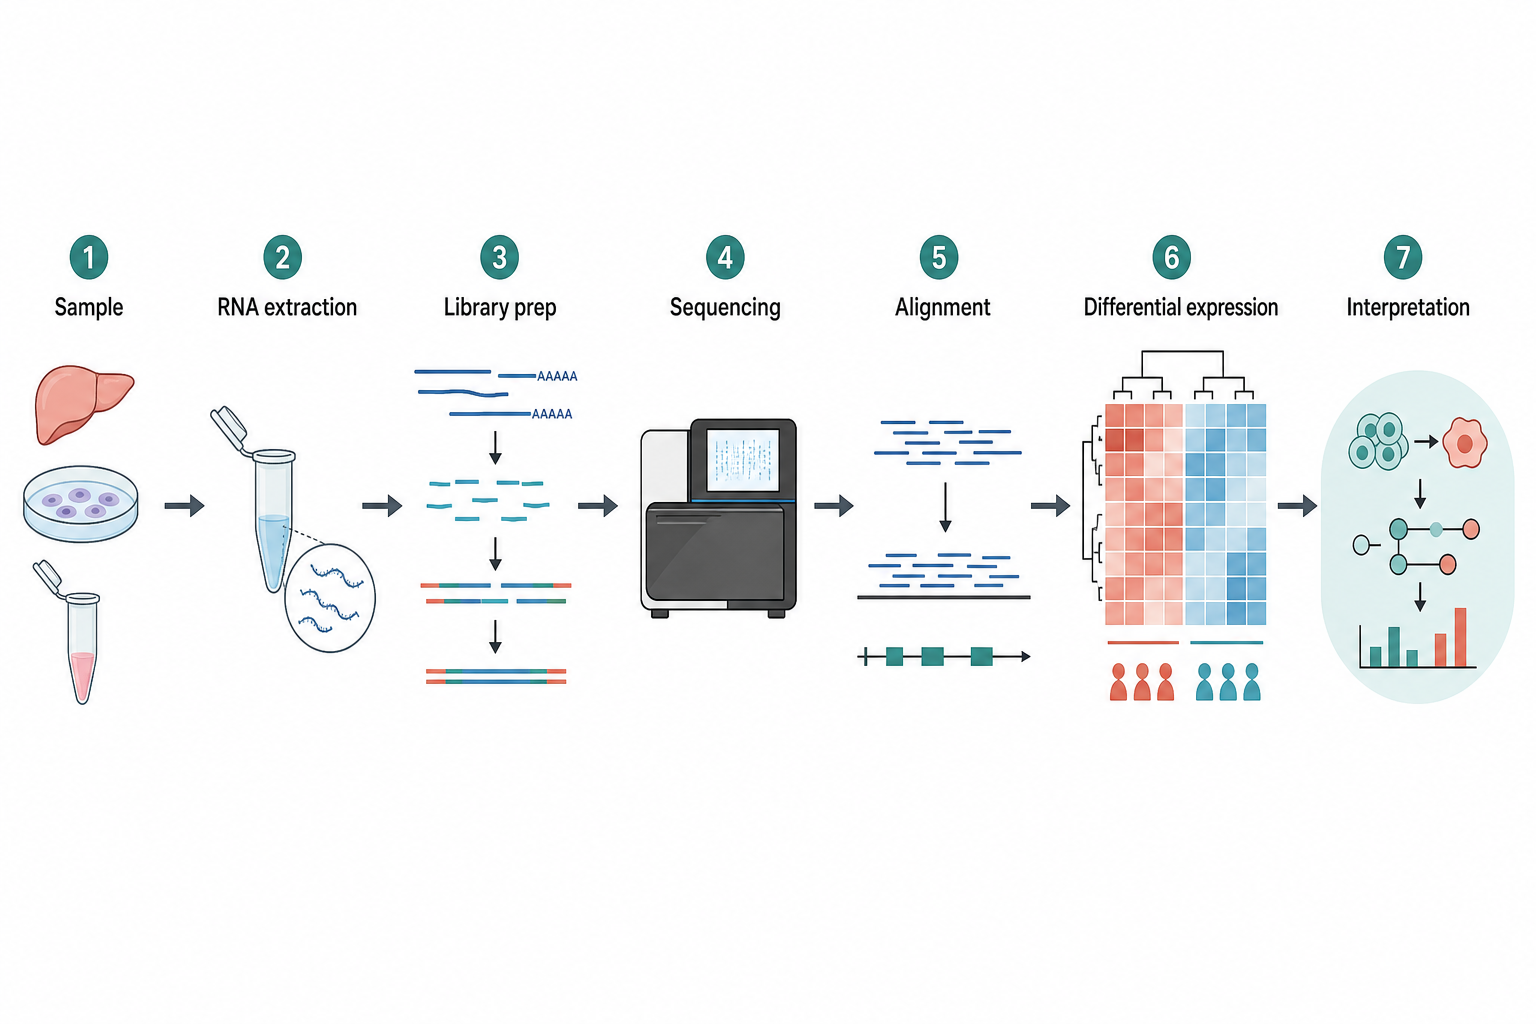 03
03Match the sequence, branching, and output labels to the actual protocol and analysis.
Prompt anatomy
A strong prompt behaves like a compact figure specification: scientific scope first, visual treatment second.
State whether this is a mechanism, method, workflow, or structural overview.
List what is measured or established and what must not be implied.
Provide exact components, labels, direction, conditions, and groups.
Specify column width, aspect ratio, grayscale needs, and visual style.
A publication-ready [mechanism / method / workflow] figure for a research paper about [subject], showing [required components, labels, and relationships]. Use [line art / flat illustration / 3D], a clear [layout], readable text, and a white background. Do not imply [unsupported relationship].
Generation produces a draft. The researcher remains responsible for every label, relationship, and implied claim.
Questions
Use analysis or plotting software for quantitative charts. This tool is intended for explanatory diagrams and illustrations, not for inventing, transforming, or representing measured data.
Line art is a strong default for mechanisms and methods. Flat illustration can clarify workflows or grouped concepts. Use 3D only when spatial depth adds necessary scientific information.
Check every element against the manuscript and source material, inspect the image at final size, remove unsupported decoration, and follow the target journal’s current disclosure and image policies.
Continue planning
Create precise mechanisms and methods that scale clearly.
Summarize the paper’s central story in one visual path.
Choose the right figure type, draft it, and review the science.
Ready to draft? The generator above is already set to a useful starting style and prompt. Replace the scientific content with your own requirements before generating.
Start your figure