

Figure type · Reviewed October 28, 2026
Experimental design diagram maker
Describe the groups, the timeline and what is measured when. The agent plans the figure, shows the plan and the credit cost, draws the design or workflow, and lets you fix one step at a time.
What an experimental design diagram is
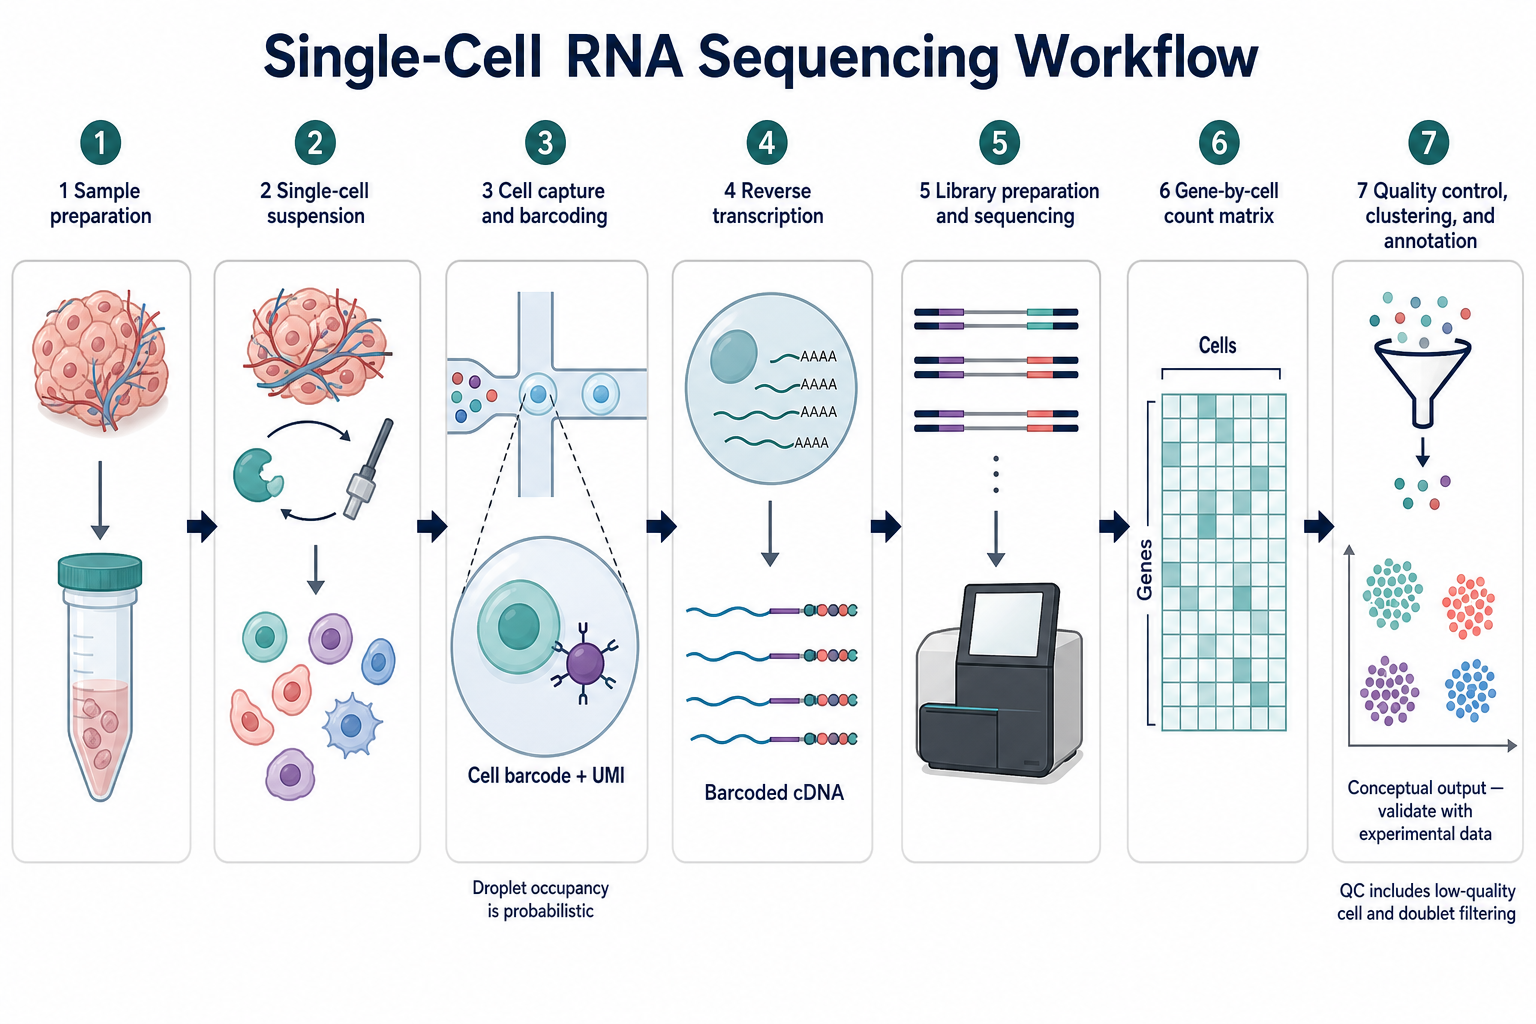
An experimental design diagram shows how a study was run: the groups or arms, how subjects were assigned, the treatments and their timing, the sampling and measurement points, and the endpoints. A workflow or pipeline figure is the same idea for a method: samples in, steps in order, data out. Both explain the design; results belong in the data figures.
Scientific figure generator
Describe your experimental design diagram
Send this design or describe your own study. The result opens on a canvas where you mark any step and say what to change.
3 free figures for new accounts, no card. Downloads have no watermark.
What it draws
- Study designs: groups, randomisation, treatments, timeline and endpoints.
- Method workflows and pipelines: sample to result, step by step.
- Clinical trial and cohort schemas, including enrolment and follow-up points.
- Sampling schemes for field and environmental studies.
What it does not draw: data
- No charts, plots, axes, error bars or significance marks: a drawn chart implies values you did not measure.
- No micrographs, blots, gels, scans or any image that would pass for an observation.
- No outcomes. An n per group, a dose or a time point is part of the design and may appear exactly as you write it; a result is not.
How to describe an experimental design diagram
The agent turns these five parts into a plan and shows it, with the credit cost, before anything is generated. The more exact the names and the arrow meanings, the closer the first draft.
- 01
Subjects and groups
What was studied and how it was split: species or population, number of groups, n per group, how subjects were assigned.
- 02
Treatments and timing
What each group received, the dose, the route and when, on a timeline with the units you use in the paper.
- 03
Measurements
What was sampled or measured at which points: blood, tissue, imaging, questionnaires, sequencing.
- 04
Endpoints and analysis
The primary endpoint and the analysis steps, so the figure ends where the results begin.
- 05
Layout
Ask for groups as parallel rows over a shared timeline, or a left-to-right pipeline with numbered steps, and name the icons you want.
Experimental design diagram templates
Made with Scientific Figure Generator. Open one, keep its layout and swap in your own parts and labels.

Single-Cell Genomics
Single-Cell RNA-Seq Workflow
Open as template
Protein Analysis
Western Blot Workflow
Open as template
Immunoassays
ELISA Workflow
Open as template
Clinical Genetics
BRCA1/2 Testing Workflow
Open as template
Genomics
RNA-Seq Analysis Pipeline
Open as template
Analytical Chemistry
LC Sample-to-Quantification Workflow
Open as templateWhat reviewers expect in an experimental design diagram
Time runs left to right
A shared timeline with day or week marks, groups as parallel rows beneath it, so a reader can see what every group received at every point.
n at every split
Give the number of subjects per group where the groups divide, and again where any are lost to follow-up; CONSORT-style figures expect it.
One icon per sample type
Use the same icon for blood, tissue or imaging every time it appears, and define the icons in the legend.
Design ends before results
The last step is the analysis or the endpoint, not a bar chart. Results go in the data figures with their statistics.
Before submitting, check the publication checklist, write the legend with the figure legend guide, and disclose the tool as the citing guide describes for your publisher.
Experimental design diagram FAQ
Keep going
Mechanism diagram maker
Draw a mechanism diagram from a description: molecular mechanisms, mechanism of action, device and process schematics. Explanatory figures only, never data.
Signaling pathway diagram maker
Draw a signaling pathway diagram from a description: receptor to nucleus, activation and inhibition, phosphorylation, compartments. Schematics only, not data.
How to write a figure legend
The six parts, five examples and eight publishers’ legend rules.
Citing AI-generated figures
Disclosure wording and the rules of ten publishers, with sources.
Describe it once. Correct it region by region.
3 free figures for new verified accounts, the plan and cost shown first, and no charge for failed results.
Start with 3 free figures